HPTLC PRO SYSTEM Details
Display
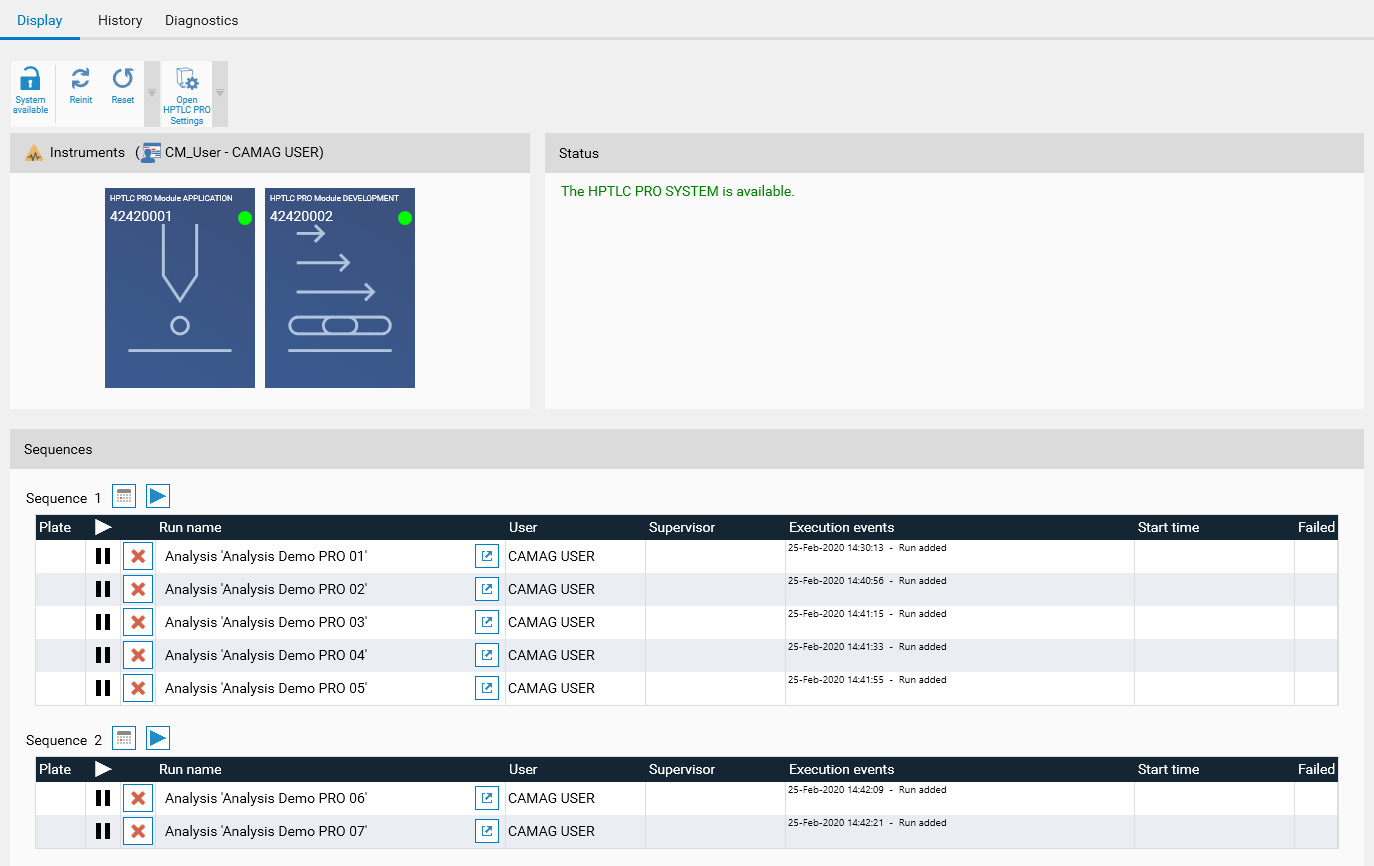
The Display tab shows the current status of the HPTLC PRO SYSTEM. More detailed than the New HPTLC PRO SYSTEM Configuration window, it is though limited to a single HPTLC PRO SYSTEM and displays the runs information.
Toolbar

 Lock/unlock each HPTLC PRO SYSTEM manually.
 The HPTLC PRO SYSTEM will reinitialize, useful after an external change (like removing a carrier). See Understanding the HPTLC PRO Module and HPTLC PRO SYSTEM initialization
 Will trigger a hard reset of each connected HPTLC PRO Module of the HPTLC PRO SYSTEM successively and also abort all the runs currently executing on the HPTLC PRO SYSTEM. See HPTLC PRO SYSTEM reset.
 Open the HPTLC PRO SYSTEM Configuration view
Instruments
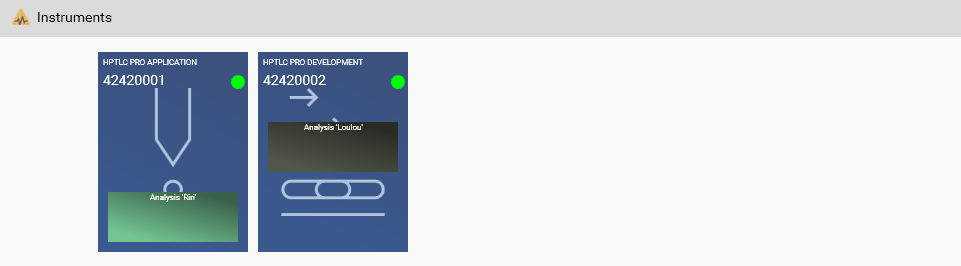
In addition to the display of the HPTLC PRO Module statuses, a schematic view of the carriers is displayed on the HPTLC PRO SYSTEM.
In the previous screenshot, one run was in progress on the second instrument and another run had its carrier on the conveyor of the first instrument. The carrier is here identified by a corresponding color in the runs sequence, and by the name of the corresponding analysis.
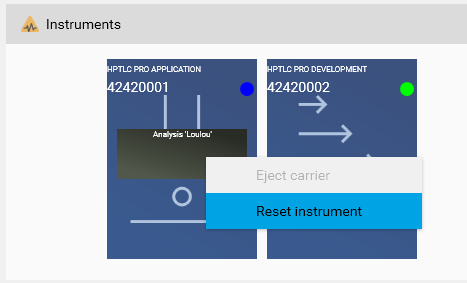
By right-clicking on the instrument:
once the HPTLC PRO SYSTEM is locked, the carrier can be manually ejected (from left to right) by using the Eject carrier function. This may be necessary after a reset, as the run was aborted but the carrier remains in the HPTLC PRO System: the Conveyor Manager signals it as unexpected.
the Reset instrument feature can be interesting in case of a critical error received from the instrument. If the instrument was performing a step of a given run while hitting the Reset instrument entry, the run is aborted but the other runs on the HPTLC PRO SYSTEM can be recovered, while a reset of the HPTLC PRO SYSTEM causes the abort of all current runs.
Status
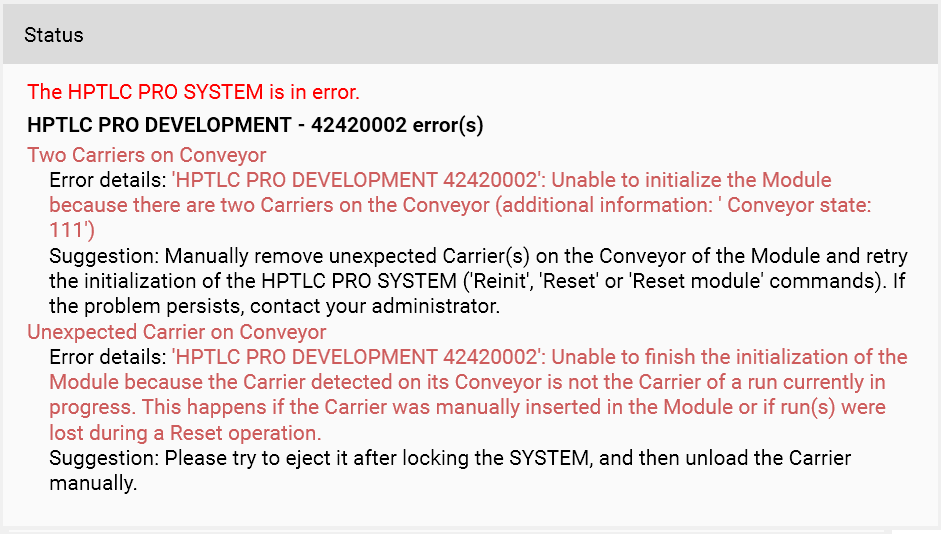
The status of the HPTLC PRO SYSTEM and any HPTLC PRO Module’s error are display here. Each error is associated with details including contextual information and suggestions on how to resolve the error. For example in the previous capture, two carriers were manually placed on the conveyor of the HPTLC PRO Module DEVELOPMENT and an initialization tentative was made by hitting the Reinit button.
Sequences
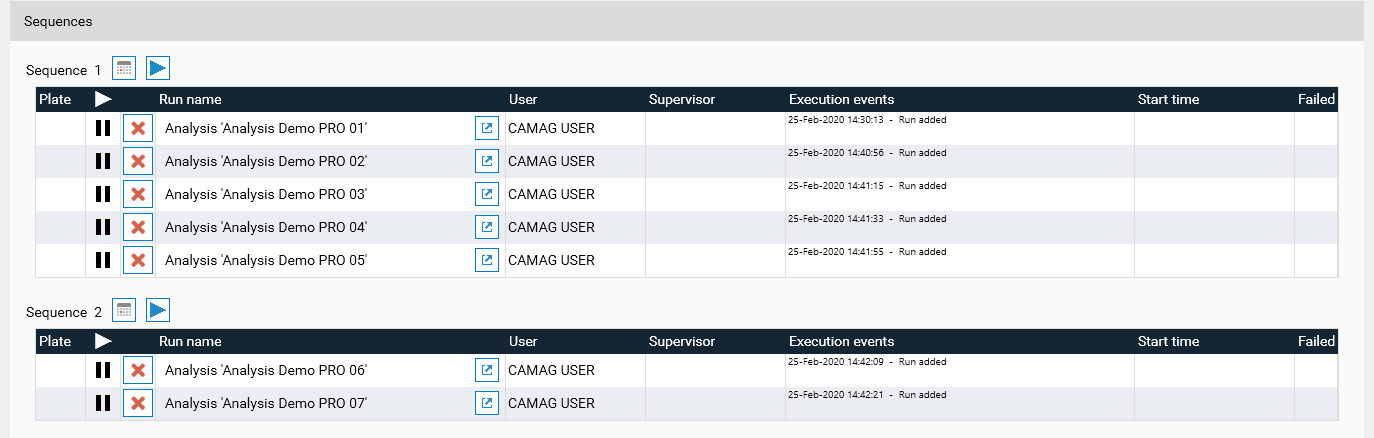
All the runs are grouped into sequences of this HPTLC PRO SYSTEM. For each sequence, the user can:
 See the rack configuration of this sequence.
 Execute the sequence. See Execution of a sequence
Note
A sequence can contain up to 5 runs.
The different columns give more information about each run.
Plate: a color code to help identify the plate/carrier in the Instruments view above (automatically generated)
Running status: either running or not
Important
A run is marked as running as soon as the sequence execution has started.
 Abort the run (only possible if the sequence is not running, otherwise must be done from the analysis.)
Run name: name of the corresponding analysis. The link will open the analysis
User: which visionCATS user added the run to the sequence
Supervisor: which visionCATS user executed the sequence and will be notified
Execution events: like in the Chromatography tab of the analysis during the execution of the run, the full list of execution events is displayed
Start time: when the run was selected for execution
Failed: display runs having an unrecoverable error (for example if a carrier is blocked during a movement on a conveyor). Failed runs are removed from the HPTLC PRO SYSTEM the next time it is initialized (for example by reenabling it or by using the Reset function)
Note
The view can also display the requested consumables when the sequence execution is started (see Consumables check).
Execution of a sequence
Click on the
button of the sequence to execute it for this HPTLC PRO SYSTEM
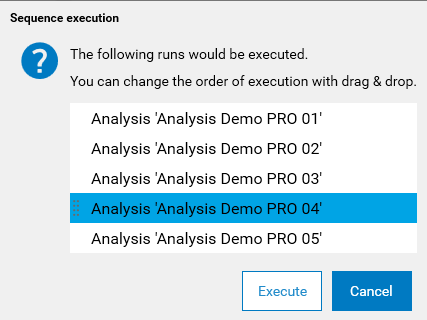
A popup will list the runs (with analysis name). It is possible to re-order the runs inside this sequence by dragging a run to another place in the list. Validate it.
The Needed consumables for execution popup and then rack position popup (if needed) will be displayed. See Consumables check. Validate when all consumables are correctly set.
The first run will then start, and after, as soon as possible, the second one, etc.
Note
The entire sequence is executed and it is not possible to execute only some runs of a sequence. The user will have to abort a run if its execution is not desired for this sequence.
History tab
The History tab is a timeline view of the activity of the HPTLC PRO SYSTEM containing all the details related to the Line itself and the execution of the runs.
Functionalities

Selection of the date range to filter. By default, today and yesterday are selected.
Filter events by category. This shows/hides events and activity events.
Filter events by minimal severity. This shows/hides events and activity events.
Toolbar
The view is not refreshed automatically. Use the Refresh button to update the view manually.
Export the history as CSV file
Display of the events related to the line
Display of the events and the activities (move and step execution) related to a given instrument
Display of the runs executed on the line
Details panel for the currently selected item (event or activity). It contains back/forward buttons to simplify the navigation.
Scroll bar to move the time interval being displayed inside the date filter chosen in 1).
Time interval being displayed horizontally.
Timeline groups
The timeline display is divided into several groups:
First, the HPTLC PRO SYSTEM group displays events related to the HPTLC PRO SYSTEM itself such as initialization errors, status changes or management events.
Then, there is a group for each HPTLC PRO Module of the HPTLC PRO SYSTEM. In each are displayed events related to the corresponding instrument and moves/execution of step in this instrument.
In the end, the Runs group displays the runs as a whole.
Types of elements
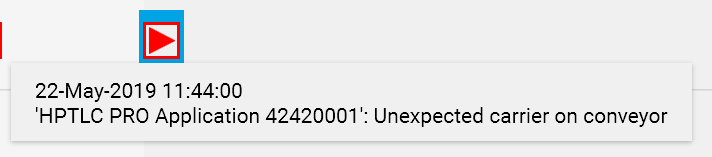
The timeline displays 2 types of elements:
Events, happening at a given timestamp. They are represented by a square, such as in the following example:
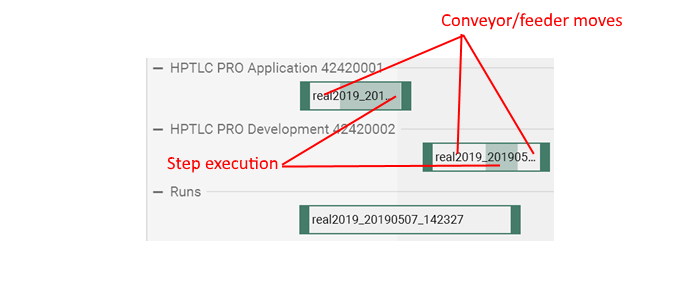
Activities, having a start and an end. This concerns the steps executed in HPTLC PRO Modules and the runs, as in the following example.
In the activities of HPTLC PRO Module, the background is partially opaque during the execution of the step. The other parts correspond to time interval where the carrier was moving to this instrument. In the following example, the run is considered finished when the execution of the step in the HPTLC PRO DEVELOPMENT was finished. The activity on the HPTLC PRO DEVELOPMENT lasts longer with a white background because of the ejection of the carrier.
Like in the Display tab, each run is associated with a color (green in the next capture). The corresponding activities on each instrument have the corresponding color, making it easy to follow visually the execution of the run across the instruments.
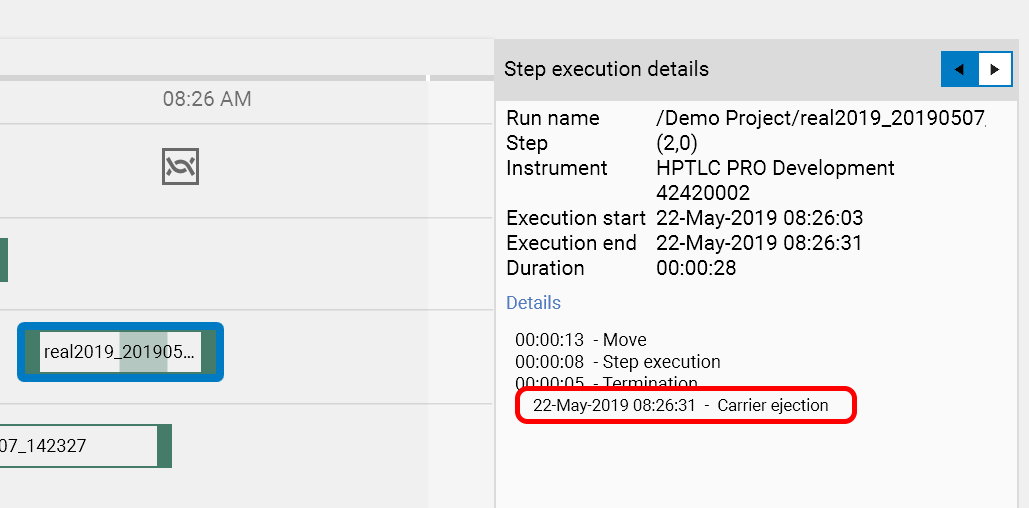
Activities also contain events. For example, when the HPTLC PRO DEVELOPMENT activity is selected, the right panel shows the carrier ejection event:
Event categories
A lot of different events can occur. In order to help the browsing through the history, several categories are defined:
 Management: such as HPTLC PRO SYSTEM enabled/disabled, HPTLC PRO SYSTEM renamed, etc.
 Run: concerns run’s event such as run start/end.
 Consumable: details the consumable changes.
 Instrument status: such as instrument connection/disconnection, warning/error received from instrument, etc.
 HPTLC PRO SYSTEM status: such as HPTLC PRO SYSTEM availability change or HPTLC PRO SYSTEM-related errors.
 Initialization: line-related or instrument-related initialization errors (therefore always red).
Severity
Depending on the event and on the context, each event is also associated with a severity, which corresponds to a color:
Information (grey)
Warning (orange)
Error (red)
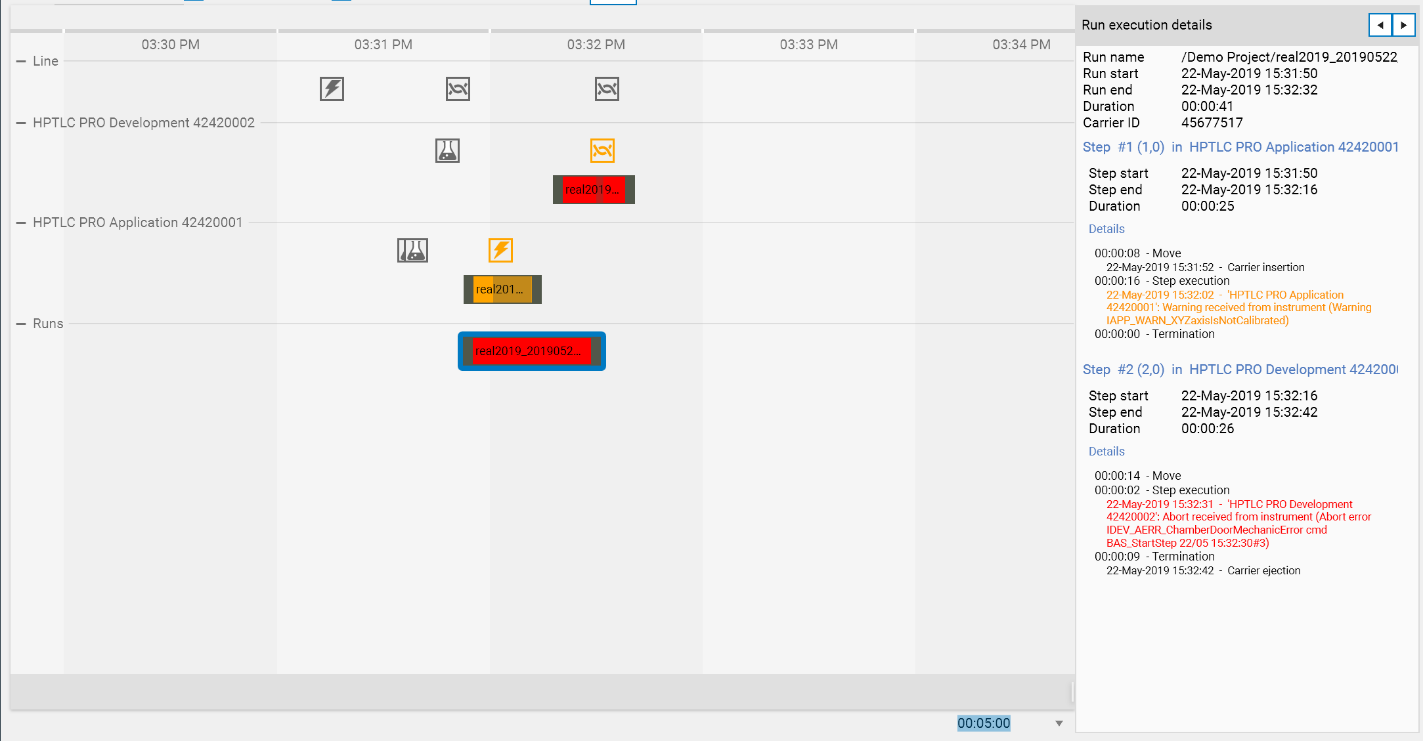
The following example shows a more complex situation where:
A warning occurred during PRO App step, which makes the activity appear as warning.
An abort error occurred during the PRO Dev step, which makes the activity appear as error.
As a result, the whole run appears as error.
The abort error events received are treated as warning at instrument level because the instrument itself can recover from such errors.
By selecting the run, the details of the events are displayed in the right panel
Diagnostics tab
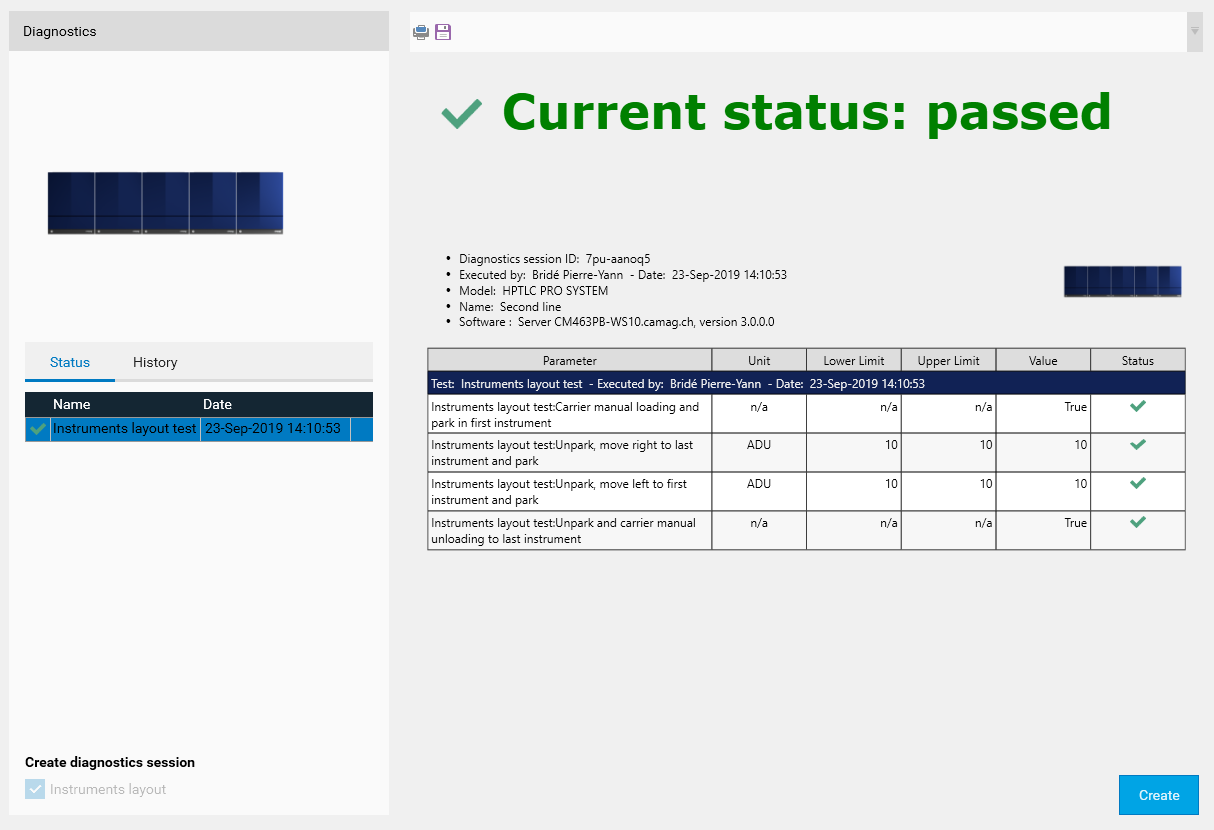
In addition to the diagnostics of each HPTLC PRO Module, a diagnostic of the HPTLC PRO SYSTEM itself is necessary to validate carrier insertion, ejection and the move from each instrument to the next one in both directions. This ensure that:
it is physically possible to load and unload carriers in the HPTLC PRO System by using manual loading/unloading positions,
the instruments of the HPTLC PRO System are correctly positioned and in the right order.
Note
The test also performs feeder moves to feeding and to processing positions as well as conveyor move to feeding position, because these are essential operations for the Conveyor Manager.
The test consists in a run defined specifically for Diagnostics, so that it works like the execution of a normal run. Consequently, it is logged the same way in the History tab.
Important
The diagnostics would not be able to start if the HPTLC PRO SYSTEM is already executing some run(s).
Specific rules apply for the HPTLC PRO SYSTEM diagnostics:
A warning popup appears when starting a run on a HPTLC PRO SYSTEM having no valid diagnostics.
An additional warning appears in the report of the analysis when a run was performed while the HPTLC PRO SYSTEM diagnostics were not valid.
HPTLC PRO SYSTEM diagnostics can only be performed when the diagnostics for all the HPTLC PRO Modules in it are valid.
If the diagnostic of a HPTLC PRO Module of the HPTLC PRO SYSTEM has expired or is being performed again, the HPTLC PRO SYSTEM diagnostics are invalidated
Any modification to the instruments list of the HPTLC PRO SYSTEM (see HPTLC PRO SYSTEM Configuration window) invalidates its diagnostics.
Apart from this, the HPTLC PRO SYSTEM diagnostics windows work like other diagnostics windows, see Diagnostics.