Data
The spectrum’s Data tab displays all the spectrum data of the current analysis.
Overview
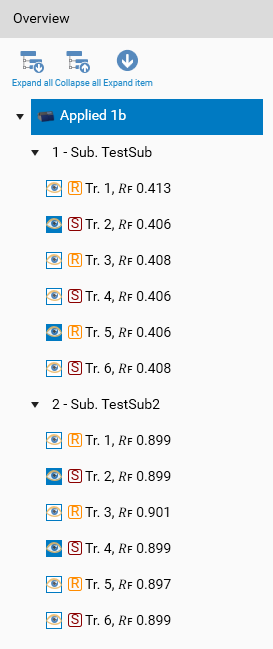
An analysis can have many spectrum scan steps, each one having many positions defined for many substances. The Overview section displays a tree allowing to select a step, a substance or a position to display its spectrum data. This section also contains the usual tree navigation buttons. When selecting a step or a substance, you can further show or hide each position by using the corresponding toggle buttons. In the following example, the spectrum data of step Developed 1d is selected but the sample tracks will not be effectively displayed.
Spectrum Scan View
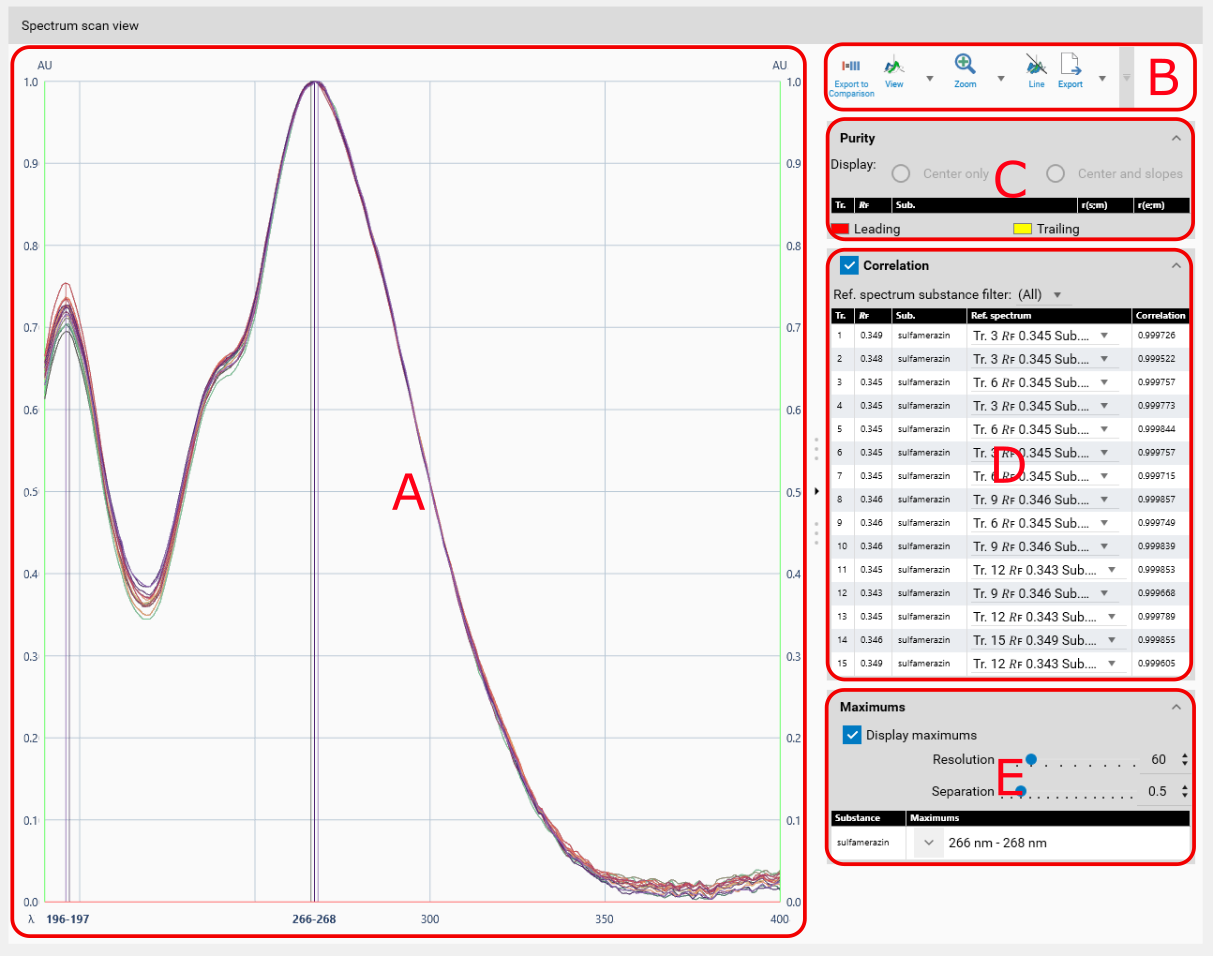
A: Display
B: Toolbar
C: Purity
D: Correlation
E: Maximums
Display
The spectrum scan view displays the data of the spectrum positions selected in the Overview section. This view uses the Profiles viewer, with the wavelength on the x-axis. The main view mode is set to Profile by default because this makes more sense than a 3D mode, but it has the same 3D capabilities as the regular Profiles viewer. The viewer groups the spectrum profiles displayed by track number. Therefore, when a step with several substances is selected in the Overview section, it’s possible to have many spectrum profiles at the same position.
Toolbar
The toolbar contains:
The Export to comparison function
The display options related to the Profiles viewer
The usual export functions
Purity
When enabled in the scanner step, the Purity section allows you to show/hide the additionally measured spectra, and a table shows the results of the correlation computed between the start and the middle spectra r(s;m) and between the middle and the end spectra r(e;m).
Note
The r(s;m) and r(e;m) values are computed by using the sample Pearson correlation coefficient.
Correlation
The Correlation allows you to define correlation between spectrum position’s data. When set, visionCATS searches by default, for each position, the nearest position defined on a reference track and sets this position as the Reference spectrum. You can then manually adjust each reference spectrum if needed.
Note
The Correlation values are computed by using the sample Pearson correlation coefficient.
Maximums
Similar to the comparison spectrum’s Maximums section.
The Maximums functions, when activated, performs a quick maximum detection algorithm on the displayed spectrum profiles. This detection has 2 parameters:
Resolution: indicates the minimum width of the maximum, expressed in nanometer.
Separation: indicates the minimum relative distance between 2 maximums.
Normally, the default values for these parameters should be appropriate in most cases. When the function is activated, the Display shows vertical lines where maximums are detected and the maximums wavelengths are added to the wavelength axis. Because there can be a lot of maximums detected, all of them can’t always be shown directly in the viewer, therefore, the full list is displayed inside the Maximums section. For each spectrum profile, several maximum may have been detected, but the ones close to 1 AU are displayed in bold because they’re probably the most interesting for the user.
Note
Unlike the Correlation function, the Maximums option is only a display helper and is not kept when the analysis is saved.