Positioning
Use the Positioning to:
select, in the Overview section, the previously defined documentation step on which the spectrum scan step is based,
select the spectrum scan step to configure in the Spectrum Definition Table section and
add substances at the desired position(s) of the plate by using the Spectrum Definition Table and the Substance Positioning section.
Overview
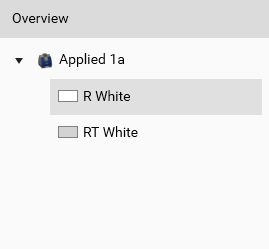
Select the illumination (for TLC Visualizer/TLC Visualizer 2 steps) or the wavelength (for Scanner steps) to display in the Substance Positioning section. Clean plate data acquisition steps are not shown. For TLC Visualizer/TLC Visualizer 2 steps, the profiles must be generated by using the Generate Profiles function in the analysis’ Data tab.
Spectrum Definition Table
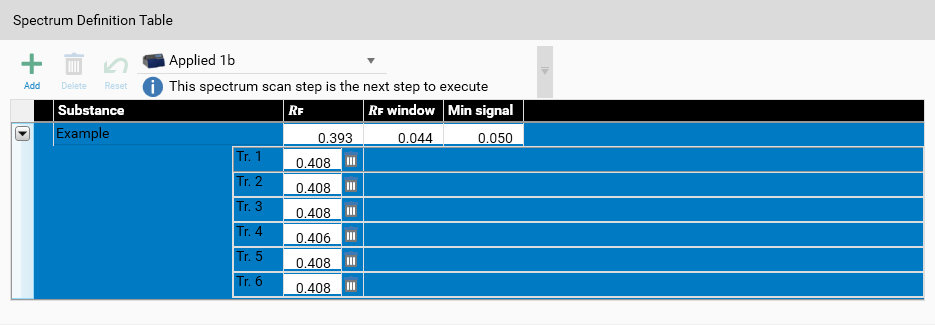
The Positioning view is primarily used to define the positions for the next step to execute. Therefore, this step (if any) is selected by default in the combobox, but you can select other spectrum scan steps of the current analysis. Of course, it’s not possible to modify positions for an already executed spectrum scan step.
The only way to add positions to a spectrum scan step is to use the main Add button, which actually adds a substance in the table. Define or choose the name of the substance and edit the 𝑅ꜰ and 𝑅ꜰ window fields in order for visionCATS to find the positions (0 or 1 for each track) displayed in the table. visionCATS searches, for each track, the local maximum in the range defined by the 𝑅ꜰ and 𝑅ꜰ window, and keeps the position found only if the luminance at this position is greater than the Min luminance.
Individual positions found can be modified manually:
Use the delete button to keep only the desired positions.
Manually edit the 𝑅ꜰ field to adjust the position if needed (possible only in the allowed range of the substance).
Note
All positions for a substance are automatically recomputed when modifying the 𝑅ꜰ, 𝑅ꜰ window and Min luminance fields. Therefore, any manual modification on positions within a substance has to be done after having defined the fields of the substance itself.
Substance Positioning
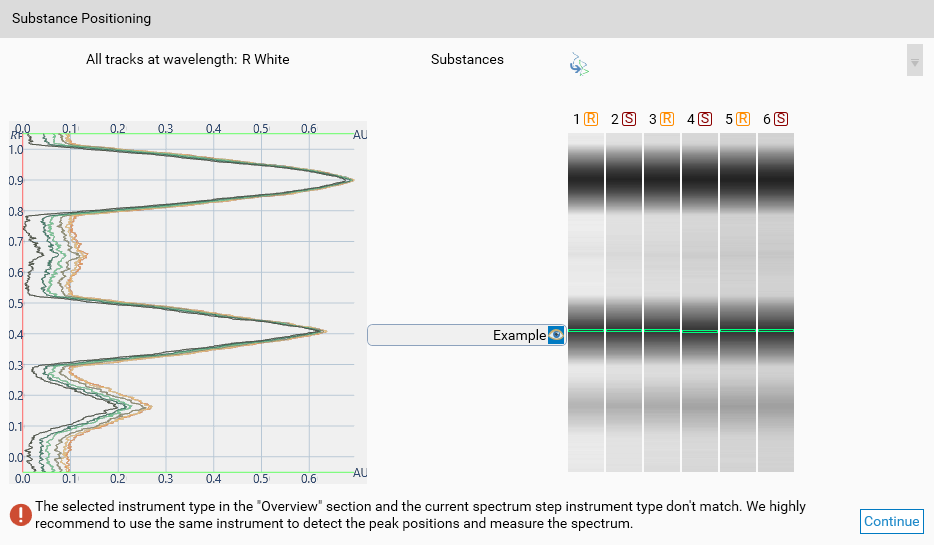
This section is similar to the one in the Substance assignment window. Instead of manually modifying 𝑅ꜰ and 𝑅ꜰ window in the Spectrum Definition Table, use the mouse to move each substance’s 𝑅ꜰ and window.
In the horizontal list on the right side, you can select each track individually. Doing this allows you to show only the corresponding profile in the left side. While a track is selected, any computation/recomputation of substance’s positions is limited to the selected track. Therefore, you can define a substance’s position for a specific track. Use the Show profiles of all tracks to reset the track selection. When a substance’s positions are defined and correctly defined, the Continue button is activated and leads to the Execution tab.
Note
A warning would be displayed if the select instrument in Overview is a TLC Visualizer/TLC Visualizer 2, as the plate positioning would be different from a TLC Scanner 3/4. The spectrum can then be measured sligthly outside of the requested spot.