Index
visionCATS
3.0
  • Introduction
    • Architecture
    • Editions and options
    • End user license information
  • What’s new in visionCATS 3.0
    • Changelog
      • visionCATS 3.0
        • Enhancements
        • Bug fixes
      • visionCATS 2.5
        • Enhancements
        • Bug fixes
      • visionCATS 2.4
        • Enhancements
      • visionCATS 2.3 SP1
        • Enhancements
        • Bug fixes
      • visionCATS 2.3
        • Enhancements
      • visionCATS 2.2
        • Enhancements
      • visionCATS 2.1
        • Enhancements
        • Bug fixes
      • visionCATS 2.0 SP2
        • Bug fixes
      • visionCATS 2.0 SP1
        • Bug fixes
      • visionCATS 2.0
        • Enhancements
      • visionCATS 1.4 SP2
        • Bug fixes
      • visionCATS 1.4 SP1
        • Bug fixes
      • visionCATS 1.4
        • Enhancements
      • visionCATS 1.3
    • CAMAG® HPTLC PRO
    • New design
    • Edit Global Lists
    • Remarks in methods
    • Report in methods
    • High DPI support
    • New docking system
    • Explorer improvements
      • In progress items selection
    • Update Database server
    • Support for Windows 7 is ending
  • Installation
    • Parts supplied
      • Content of the visionCATS installation disc
    • PC System Requirements
      • System Requirements
      • Installation Drive
      • Communication ports
      • Supported operating systems
      • Color quality
      • System printer (optional)
      • Additional software installed
    • Installation procedure
      • Troubleshooting
    • Installation of USB to RS232 adapter
      • Troubleshooting for RS232 adapter
    • Installation of TLC Visualizer camera
      • OHCI driver installation
      • Camera driver installation
      • Configuration for Windows 10
    • Installation of TLC Visualizer 2 camera
      • Camera driver installation
    • Installation of HPTLC PRO driver
    • Update of TLC/HPTLC instrument firmware
      • For instruments with RS232 connection
      • For the camera of TLC Visualizer
    • Update of HPTLC PRO Module firmware
  • Main window
    • Main Toolbar
      • Title bar
      • Main toolbar and menu
    • Toolboxes
      • Project Explorer Toolbox
      • Instruments Toolbox
      • System Log Toolbox
    • System Status Bar
      • Last system log entry
      • HPTLC PRO SYSTEM status
      • Selection of the HPTLC PRO SYSTEM
      • Selected HPTLC PRO SYSTEM status
      • Login of current user
      • Name of the visionCATS server and status of all instrument services:
      • Used memory by the client
  • File Explorer
    • Main explorer view
      • 1.Contents of the current folder
      • 2. Navigation
      • 3. History
      • 4. Status bar
      • 5. Sort options
      • 6. Search options
        • Default textual search
        • Simple search shortcuts
        • Advanced search
    • Preview view
    • File Types
    • File Status
    • File Actions
      • Menu New
      • Menu File
      • Menu Edit
      • Menu Tags
  • Method / Analysis File
    • HPTLC Steps
    • Chromatography
      • Track Assignment
      • Instrument step parameters
        • Plate Layout
        • HPTLC PRO APPLICATION
        • ATS 4
        • Linomat 5
        • Manual application
        • HPTLC PRO DEVELOPMENT
        • ADC 2
        • AMD 2
        • Chamber
        • Immersion
        • Spraying
        • Derivatizer
        • TLC Visualizer/TLC Visualizer 2
        • TLC Scanner 4
        • TLC Scanner 3
      • Instrument step execution
        • Instruction display
          • HPTLC PRO
        • Execution display
          • Data acquisition steps
          • TLC Visualizer/TLC Visualizer 2
          • TLC Scanner 3/TLC Scanner 4
          • HPTLC PRO
    • Data View
      • Images View
        • DataView Toolbar
          • General tools
          • 𝑅ꜰ Tools and Tracks
          • Image Settings
            • HDRI Settings
          • Annotations
      • Tracks View
      • Profiles View
    • Spectrum
      • Positioning
        • Overview
        • Spectrum Definition Table
        • Substance Positioning
      • Execution
      • Data
        • Overview
        • Spectrum Scan View
          • Display
          • Toolbar
          • Purity
          • Correlation
          • Maximums
      • Correlation
        • Overview
        • Spectrum Correlation Data
    • System Suitability Testing (SST)
      • SST Table
      • Overview
      • SST View
    • Evaluation
      • Definition
        • Track assignment
        • Substance Table
        • References
        • Samples
      • Integration
        • Overview
        • Peaks table
        • Profiles view
        • Integration tools
          • Bounds
          • Smoothing
          • Baseline
          • Profile Subtraction
          • Peaks
            • Interactive baseline
              • Toolbar
              • Baseline segments list
              • Spline type
              • Example
            • Manual peak edition
              • Peak’s start and end edition
      • Substance assignment
        • Substances table
        • Profiles view
        • Substances view
        • Tracks view
        • Toolbar
      • Calibration
        • Overview
        • Height/Area views
        • Calibration function view
      • Results
      • Related Substances
        • Overview
        • Defining main and related substances
        • During the calibration
        • In the results
      • Internal standard
        • Overview
        • Defining the internal standard
        • During the calibration
        • In the results
      • Reproducibility
        • Overview
        • During the definition
        • In the results
      • Limit Test
        • Overview
        • During the definition
        • In the results
    • Remarks
      • Editing features
      • Limitations
    • Report
      • Report Settings
        • Report template selection
        • Report template options
        • Tracks data options
        • Data acquisition options
        • Image display options
        • Evaluation options
        • Log options
      • Outline
      • Preview
      • Method’s report
    • Log
    • Export of data
      • Peaks table export
      • Substance assignment export
      • Evaluation results export
      • Profile data export Only with Export data option
        • Raw profiles export Only with Export data option
        • Integrated profiles export Only with Export data option
        • Comparison profiles export Only with Export data option
      • Spectrum export Only with Export data option
        • Analysis spectrum data export Only with Export data option
        • Comparison spectrum export Only with Export data option
  • Comparison Viewer
    • Overview
      • How it works
      • Common functionalities
    • Export to comparison
      • Overview
      • Images and profiles export to comparison
      • Spectrum export to comparison
    • Image comparison
      • Display
      • Overview
      • Illumination selection
      • Toolbar
      • Track information
    • Profile comparison
      • Tracks view
        • Display
          • Overlay
          • Stack
        • Overview
        • Wavelength or illumination selection
        • Toolbar
        • Tools
        • Profile selection
          • Profile selection’s toolbar
          • Profile selection’s lists
      • Wavelengths view
    • Spectrum comparison
      • Display
      • Overview
      • Spectra to display
      • Toolbar
      • Maximums
      • Spectrum definition selection
    • Remarks
    • Report
      • Report template selection
      • Report settings
        • Global settings
        • Image settings
        • Profile settings
        • Spectrum settings
    • Log
  • Tools
    • Vial/Substance Editor
      • Vial List
      • Substance List
      • Selected Vial
      • Selected Substance
      • Substance in Vial
    • Method Library
      • Downloading and using CAMAG Methods
      • Download by using the Standalone Downloader
      • Method deployment
      • Additional features
    • Global Lists Editor
      • Toolbar
  • Administration / Options
    • Licensing
      • General information
      • Activation
      • Upgrades
        • Re-activating your existing license
      • Hardware changes
    • User Management
      • System Settings
      • Users
        • Toolbar
        • User table
    • Diagnostics
      • Diagnostics expiration for HPTLC PRO Module
        • Diagnostics view
        • How to do the diagnostics
    • visionCATS Diagnostics
      • Properties
      • Client Diagnostics
    • Instrument Properties
    • Instrument IQ/OQ
    • General Settings
      • Installations
        • Toolbar
        • Main installation table
      • COM Ports
        • Toolbar
      • USB Ports
        • Toolbar
      • Instruments Configuration
      • Global Configuration
        • Analysis
        • Notifications
    • User Options
      • Miscellaneous
        • Method and analysis options
        • Dialogs options
        • CSV export options
      • Notifications
    • Report Settings
      • Reports Configuration
        • Reports header logo
        • Reports page setup
        • Global CSS
      • Report templates
      • Report templating
        • Technologies
          • HTML
          • CSS
            • Colors
            • SCSS
          • JavaScript
            • Handlebars
            • linq.js
            • Flot
            • SignalR and Metamorph
            • Other JavaScript libraries
          • wkhtmltopdf
        • Breaking changes
          • visionCATS 3.0
            • New instrument names
          • visionCATS 2.5
            • Unit converter functions
            • Sample reference amount
        • Versioning
        • Debugging the report template
          • PDF generation debug
          • PDF generation temporary folder
            • Report temporary files structure
          • Debugging tools
            • Web browser’s developer tools
            • Code editor
        • Changing template styles
          • Global and template specific styles
          • Tutorials
            • Changing the global styles
            • Overriding global styles for a specific template
        • Changing template structure
          • General structure
          • Heading and report overview
          • Tutorials
            • Simple re-ordering and visibility
            • Header logo only on the first page
            • New layout
            • Displaying only log of a specific type
              • Simple filter
              • Filtering and only the motivated text
  • Profiles viewer
    • Axis
    • Navigation in 2D
      • Zooming the view
        • One axis zooming
      • Panning the view
    • Navigation in 3D
      • Zooming the view
      • Panning the view
      • Rotating the view
    • Viewing modes
    • Export
  • HPTLC PRO
    • Terminology
    • HPTLC PRO Settings
      • HPTLC PRO SYSTEM Configuration
        • Main toolbar
        • HPTLC PRO SYSTEM row
          • HPTLC PRO SYSTEM toolbar
    • HPTLC PRO SYSTEM Details
      • Display
        • Toolbar
        • Instruments
        • Status
        • Sequences
        • Execution of a sequence
      • History tab
        • Functionalities
        • Timeline groups
        • Types of elements
        • Event categories
        • Severity
      • Diagnostics tab
    • HPTLC PRO Module
      • Properties tab
      • Manual control tab
        • HPTLC PRO APPLICATION
        • HPTLC PRO DEVELOPMENT
      • Diagnostics tab
      • Operations tab
      • Firmware tab
    • Status colors
      • HPTLC PRO SYSTEM status
      • HPTLC PRO Module status
    • Conveyor Manager
    • Analysis splitting in HPTLC/TLC steps and HPTLC PRO runs
    • Execution
    • Understanding the HPTLC PRO Module and HPTLC PRO SYSTEM initialization
    • HPTLC PRO SYSTEM reset
    • Consumables validation
      • Consumables check
        • Vial position in HPTLC PRO APPLICATION’s rack
    • Setup
    • Typical execution
  • 21CFR Part 11 compliance
    • Understanding the logging features
    • System logger
    • HPTLC Logger
    • Data deletion
    • Motivated change
    • Open as management
    • E-Signature
    • Data integrity
      • How to setup Windows user rights for data integrity
  • Backup / Restore
    • Backup procedure for visionCATS
    • Restore procedure for visionCATS
    • Scheduling backup
      • Automatic backup
      • Manual backup
        • Configure network share for scheduled backup
          • Network architecture
          • Setting backup folder
          • Creating the network share with correct rights
          • Setting backup folder: retry
  • Maintenance and troubleshooting
    • General maintenance
    • Service Tool
    • Known Issues and Workarounds
  • Glossary
visionCATS
  • »
  • Method / Analysis File »
  • Evaluation »
  • Related Substances

Related Substances

Overview

The Related Substances functionality allows you to calibrate a substance of an evaluation with the calibration curve of another substance. A typical use case consists in the quantification of impurities in drug substances. The Main substance is the main component of the drug while each impurity is a Related substance. In order to confirm that the related substances are impurities, the sum of their quantities must not exceed a defined limit (normally 2% of the main substance). Therefore the typical workflow consists in:

  • Quantifying the main substance at an appropriate set of concentration/volume applied,

  • Quantifying the related substances at an appropriate set of concentration/volume applied, normally smaller than the set used for the main substance, and

  • Using the calibration curve of the main substance for the calibration of the related substances.

Defining main and related substances

../../_images/related_substances_definition.png

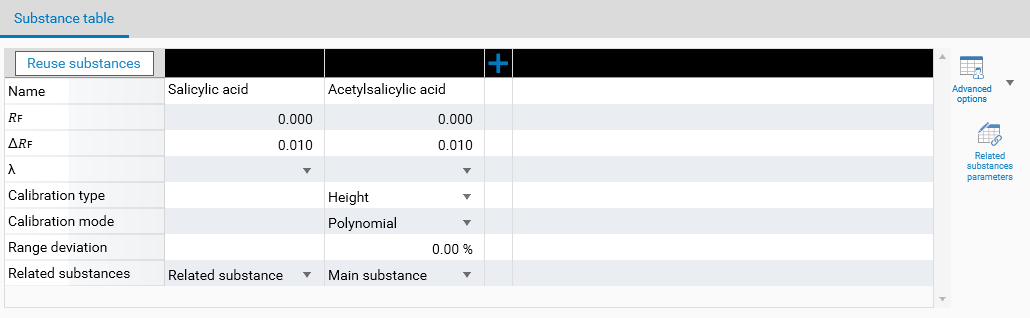
In the evaluation’s Definition tab, use the Advanced options button to make the Related substances field appear. In an evaluation, there can be only one Main substance, other substances can be of type Related substances or Default. Of course, the functionality will only work if the main substance and at least one related substance are defined. Because the related substances use the calibration curve of the main substance, the calibration-related fields are hidden for related substances.

The related substance functionality can be used in 3 modes, accessible by clicking on the Related substances parameters button :

  • Default: this is the simplest and the most generic mode, already present in winCATS, where only the substitution of the calibration curve is done for each related substance. This mode offers the most freedom but gives only the normal results of the quantification. The 2 other modes include the Allowed impurity amount field which enables the computation of the sum of impurities for each track.

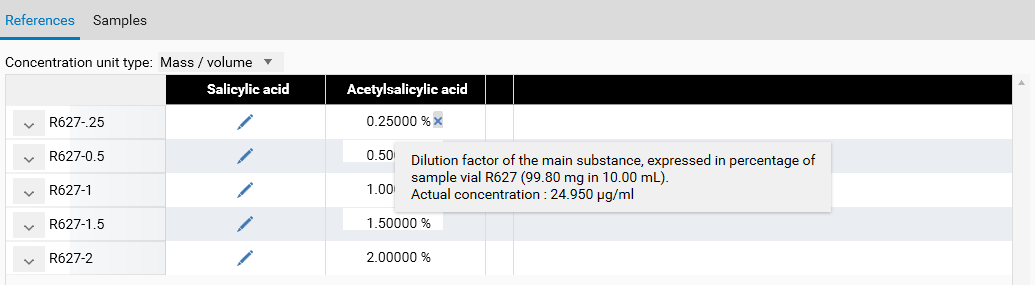
  • By dilution: use this mode when a vial defined as Sample in the evaluation has been diluted (one or many times). Each dilution gives its own vial ID defined as Reference in the evaluation. In the configuration of this mode:

../../_images/related_substances_dilution.png

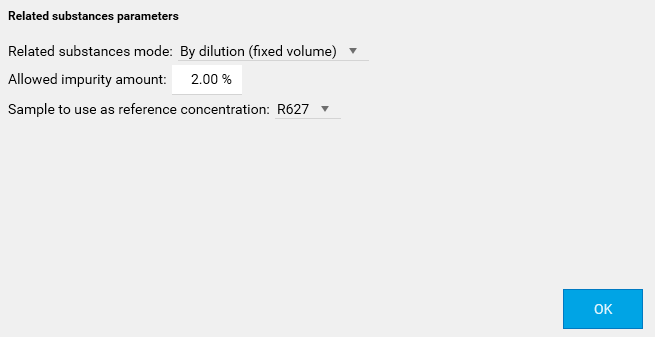
The Sample to use as reference concentration field has to be filled and the corresponding sample’s Amount and Volume solution in the Samples section have to be defined.

../../_images/related_substances_dilution_sample.png

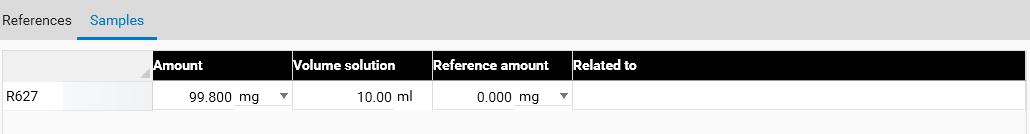
The Amount and Volume solution fields give a reference concentration, and the volume applied has to be the same for all applications of this sample, therefore, there’s a reference quantity too, which will be used when computing the results of the evaluation. In the References section, once the reference concentration is defined, the dilution factor can be directly entered instead of the concentration, and the tooltip explains the correspondance between the dilution factor and the actual concentration:

../../_images/related_substances_dilution_reference.png

  • By volume: use this mode when the same vial is used on many reference tracks in the evaluation at different volumes. A correspondance between one of those reference application and the known amount of impurities (in %) has to be defined:

../../_images/related_substances_volume.png

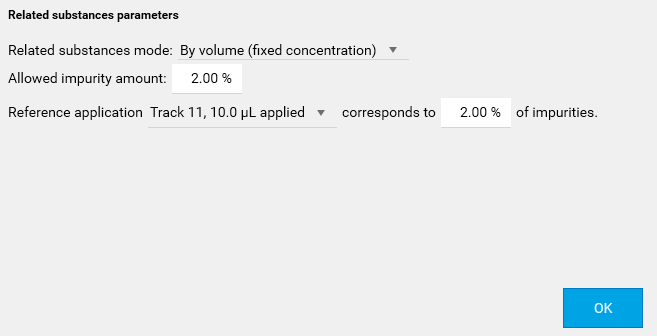
Similar to the By dilution mode, this configuraction actually gives a reference quantity which will be used as a basis to compute the results in percentage.

During the calibration

During the Calibration phase, the sample points are not computed for the main substance. Indeed, the goal is to quantify the related substances. When a related substance is displayed:

  • The calibration configuration on top of the view is not modifiable and shows the calibration data of the main substance

  • An information text recalls the main substance

  • The tooltip on a reference or sample calibration point shows the additional relative quantity computed (only in By dilution and By volume modes)

  • The x-axis is expressed in percentage (only in By dilution and By volume modes)

../../_images/related_substances_calibration.png

In the results

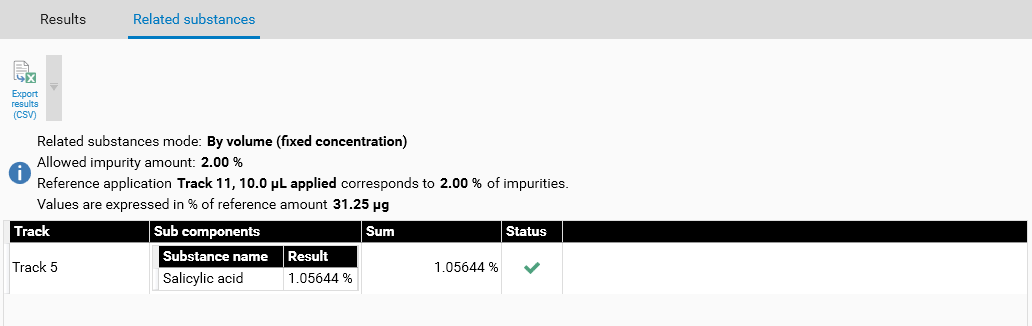
In the Results tab, the results are not displayed for the main substance of the evaluation. When the By dilution or the By volume mode is selected, a Related substances tab appears. It displays, for each track, the details of the related substances percentages. In order to confirm that the related substances are impurities, the Status field indicates whether some tracks exceed the allowed impurity amount.

Use the Export results (CSV) button to get a flattened table of the related substances results useful for future processing.

../../_images/related_substances_results.png
Previous Next

© Copyright 2022, CAMAG. Last updated on Oct 24, 2022.

visionCATS version: 3.0
Versions
2.4
2.5
3.0
3.1
3.2