Limit Test
Overview
The Limit test functionality allows you to determine whether the quantity or the concentration of a substance in some sample tracks is
Above (i.e. the sample should contain at least), or
Under (i.e. the sample should contain at most), or
At a defined limit.
The limit test itself is a fail/pass check for each sample track.
During the definition
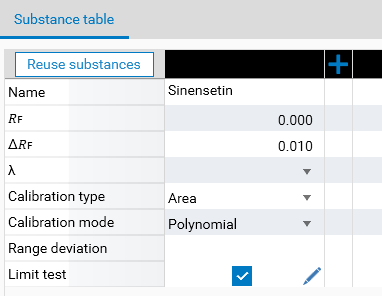
In the evaluation’s Definition tab, use the Advanced options button to make the Limit test field appear. This field can be activated/deactivated independently for each substance. In this mode:
the integration and substance assignment phases are done the same way as for other substances,
during the calibration, all samples are included automatically (except if there’s no solution of the regression), that’s why the Range deviation field is hidden.
Note
Polynomial regression is selected in the example, but in most cases, a one-point (Linear-1) calibration is probably more appropriate.
For each substance used for limit test, a set of parameters can be configured by using the Edit button.
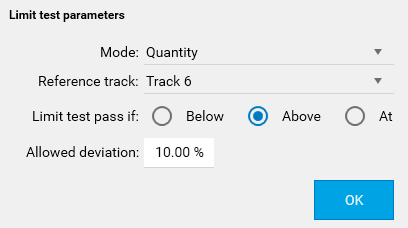
Mode: choose between Quantity (quantity of substance applied on one reference track) or Concentration (concentration of a substance in a given vial used in a reference track of the evaluation).
Reference vial (in Concentration mode) or Reference track (in Quantity mode): this gives the reference quantity/concentration which will be the limit to test.
Limit test pass if: choose between Above (minimum limit test, sample should contain at least), Under (maximum limit test, sample should contain at most), or At (sample should contain the same quantity/concentration as the reference one, +/- the allowed deviation defined).
Allowed deviation: for example, with a reference concentration of 1 ng/ml, an allowed deviation of 10% and a limit test set to pass if Above, the limit test will pass if the sample concentration computed exceeds 0.9 ng/ml.
In the results
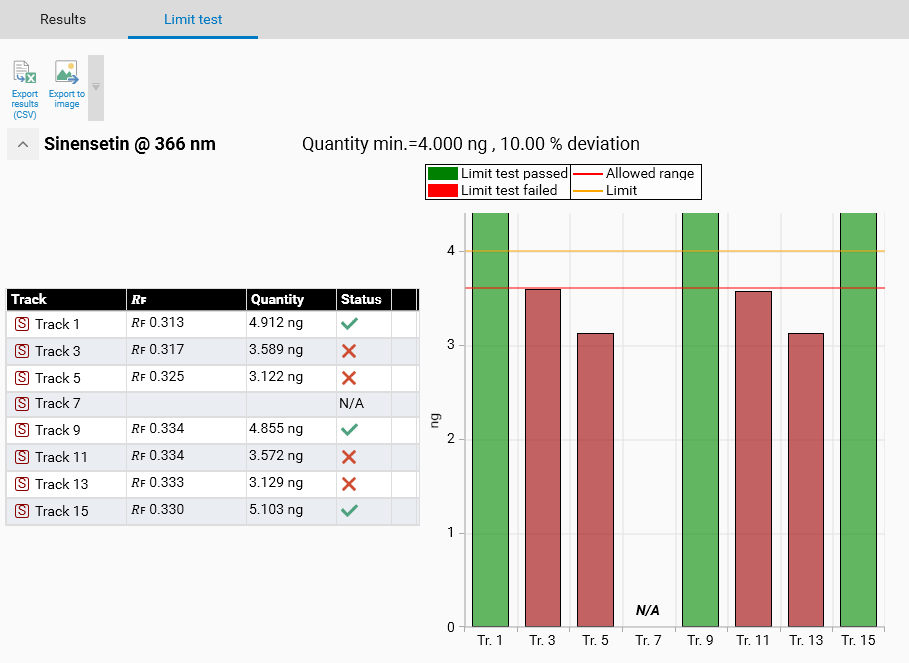
In the Results tab, the limit test results are displayed in a separate tab. For each substance, the description of the limit test parameters is displayed in the header, followed by:
A grid view of the sample results (quantity or concentration) and the associated pass/fail icon.
A corresponding graphic view with a legend.
Use the Export results (CSV) button to get a results table useful for future processing.
Use the Export to image button to get the image of a limit test graph, useful for future documentation.
Note
By convention, a sample track is displayed even if it does not have any assignment to the substance. In this case, no result is computed and the track has an associated N/A label.