Report
Note
Many functionalities of the comparison report are similar and are already explained in the analysis’ Report part. Please read it first.

Report template selection
visionCATS offers the following built-in comparison report templates:
Full report: this report displays the data of each tab of the comparison (images, profiles, spectrum) separately.
The images and profiles parts begin with the description of each items in the references and the samples lists. Then, the data is displayed, grouped by steps/wavelengths.
For the spectrum part, each spectrum definition item is directly detailed and it’s data displayed, one after another.
Image report: equivalent of the full report, limited to image data.
Image samples report: equivalent of the comparison report of visionCATS 2.3, limited to image data, where each sample is displayed against all references, along with a pass/fail validation section.
Profile flip report: this report displays all reference/samples combination couples in all steps/wavelengths, with the sample track being flipped to facilitate visual Rf comparisons.
Profile overlay report: overlay view of profiles (in 2D profile mode). Each track is colored the same way as in the Profile tab.
Spectrum report: overlay view of spectra (in 2D profile mode). Each spectrum is colored the same way as in the Spectrum tab.
Report settings
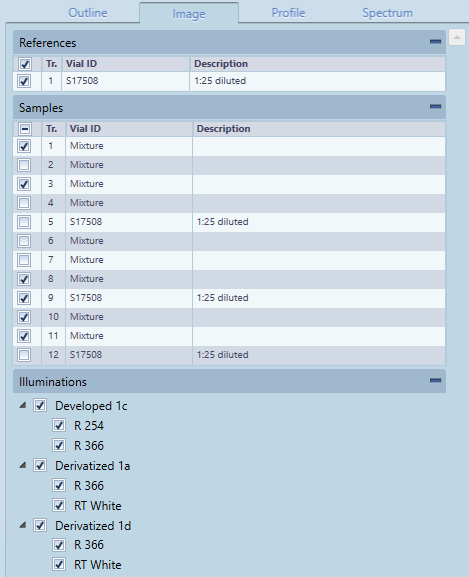
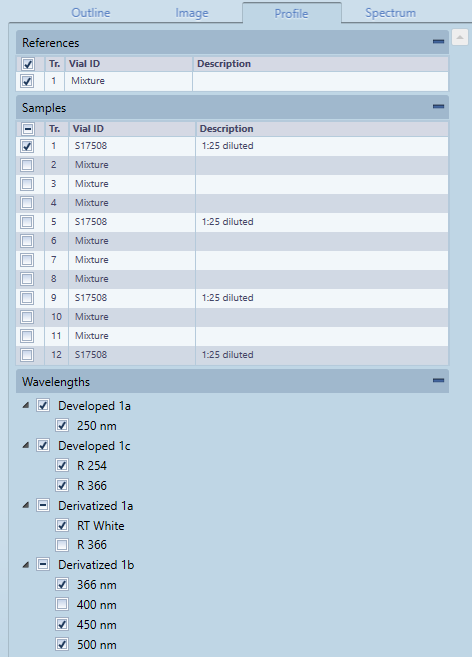
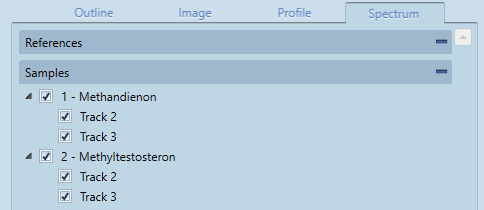
In the general settings’ Report templates section, each (non built-in) comparison report template can be configured to load image and/or profile and/or spectrum data. Depending on this configuration, the Image, Profile and Spectrum tabs next to the Outline tab will appear or not.
Image settings
In this section, configure the reference tracks, sample tracks and step/illumination data to load.

Profile settings
In this section, configure the reference tracks, sample tracks and step/wavelength data to load.

Spectrum settings
In this section, configure the spectra to load for each spectrum definition item.
