Spectrum
The main goal of the Spectrum functionality is to perform and analyze measurements for a wavelength range at given positions on the plate. visionCATS uses the following process to perform spectrum measurements:
First, define a scanner step (Scanner 3 or Scanner 4) in the HPTLC Steps tab after an existing (non-clean) documentation step. In the Chromatography tab, choose Spectrum as Scanner type in the settings of the scanner step and configure the corresponding spectrum parameters. You can define this step in a method or an analysis just like any other step. A previous documentation step is required because you’ll have to define the positions of the spectrum based on existing profile data coming either from Visualizer generated profiles or from Scanner profile data.
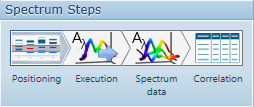
Positioning: Define where the spectrum measurements have to be performed by adding substances and affecting positions on tracks to perform the measurements to.
Execution: When the positions are defined, execute the spectrum scan step, see the data being acquired and accept/abort the step.
Data: Browse the spectrum data obtained during the spectrum measurements for further analysis, with purity information when available. Optionally, configure the correlation between tracks and display the maximums.
Correlation: Browse the correlation data computed for all the spectrum steps of the analysis.
Note
Define new spectrum scan steps and executing them is only possible on visionCATS installations having the Spectrum scanning option.
Each analysis has an unique Spectrum tab for all spectrum scan steps defined. This tab contains the following steps: