Substance assignment
In Substance assignment phase, you assign the interesting peaks to their respective substance. This makes the link between:
The track (either reference or sample) where the peak was located and its applied vial(s) (multiple applications possible in case of overspots), and
The substance assigned and the substance/vial couples defined in the Definition tab.
The Overview section displays the wavelength(s)/illumination(s) selected during the Integration. Indeed, for each substance, you can select and display the wavelength/illumination the substance has to be assigned to.
The main view is made of the following parts:
Substances table (top)
Profiles view (bottom left)
Substances view (bottom middle)
Tracks view (bottom right)
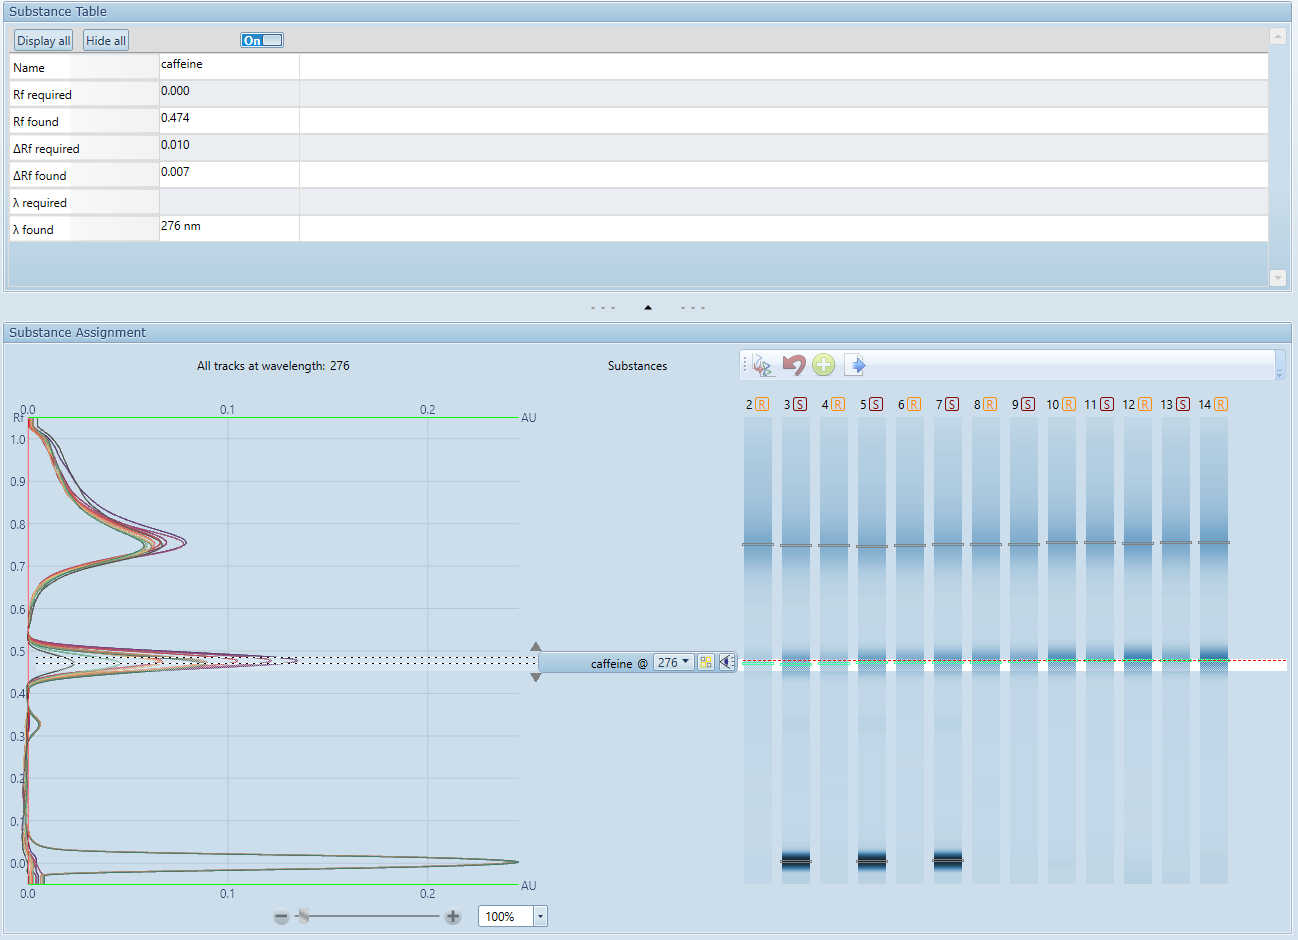
When going to the Substance assignment tab, each unassigned substance is automatically assigned, based on the Rf required and ΔRf required values defined in the Definition tab. When several peaks are in the range on a given track, the highest peak is chosen. Then, Rf found and ΔRf found values are computed, respectively as the mean Rf value of the peaks found and as the minimal value possible containing all the peaks. The same applies when modifying manually the Rf or ΔRf values (see the next sections Profiles view and Substances view). In other words, the determination of the Rf found and ΔRf found values is semi-automatic.
Substances table
The table recalls the substances defined in the Definition tab and brings the following features:
The display of the Rf, ΔRf and wavelength values effectively used (idenfied as “found”) along with the values eventually configured during the definition (identified as “required”),
The On/Off switch for each substance, along with the display all/hide all buttons, allows the user to better focus on a specific substance when the peak separation is small.
Profiles view
The Profiles viewer shows the track profiles of the selected wavelength in the Overview section. Depending on the configurations made during the Integration, the peaks and the tracks are only detected and shown on tracks switched On and within the Bounds defined. There is also a vertical zoom feature on the whole bottom view, which allows the user to focus on a specific portion of the track.
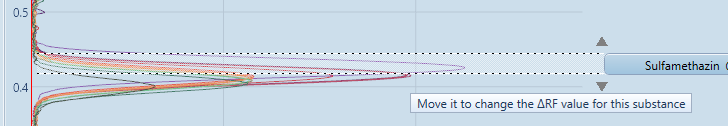
When a substance is selected, an overlay is displayed on the profiles viewer, corresponding to the ΔRf range around the Rf position found for the substance.
You can change the ΔRf of the substance by dragging one of the dashed lines or one of the triangles:
Substances view
Each substance is displayed by a thumbnail (placed on the corresponding Rf):
The following actions are possible on each substance’s thumbnail:
- Change the Rf of the substance
By dragging the thumbnail.
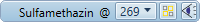
 Select the used wavelength
By selecting a wavelength in the combo-box.
 Manually assign a peak to the substance
When switched on, you can select one peak per track. You can also unassign a peak by clicking on it. When you have finished the assignment for all tracks, switch off the button.
 Display the assignment
By clicking on the eye button the overlay on profiles view and tracks view is displayed. The column of the substance is also selected in the Substance Table.
Note
Performing a manual assignment does not trigger the automatic computation of the Rf found and ΔRf found values.
Important
Manually assigned peaks are lost when computing the Rf found and ΔRf found values.
Caution
Manual assignment gives you the choice to select any peak: it is possible to have two substances crossing across the plate, which may or may not be correct.
Tracks view
All active tracks are displayed. In case of a Visualizer step, the pseudo tracks coming from the profile generation are shown, not the image itself:

To the right of the track number, the type of sequence is displayed,  for reference and
  for sample. The icons have tooltips displaying the application in details.
On each track, each detected peak is displayed by a small rectangle around the max. Rf position (peak start and end aren’t displayed).
The color of the peak rectangle corresponds to:
Grey: peak without an assigned substance
Green: peak with an assigned substance
Yellow: assigned peak of the selected substance
When a substance is selected, an overlay is displayed on all tracks, the white band showing the ΔRf found, and the dashed red line the Rf found value used for the substance.

Note
A specific track (and its profile) can be selected by clicking on it. Multiple selection is not allowed.
Toolbar
The toolbar give access to some advanced functionalities:
 Show all tracks: resets the selection of a specific track
 Reset assignment: restart the automatic substance assignment
 Add substance: you will be asked to click on a peak, a new substance will be automatically assigned to it
 Export the substance assignment data to a CSV file (this is the same export as the one in the Peaks table, but limited to assigned peaks)