Tracks View
The track view shows all available data (image tracks, track scans), one track at a time across different wavelengths/illuminations.
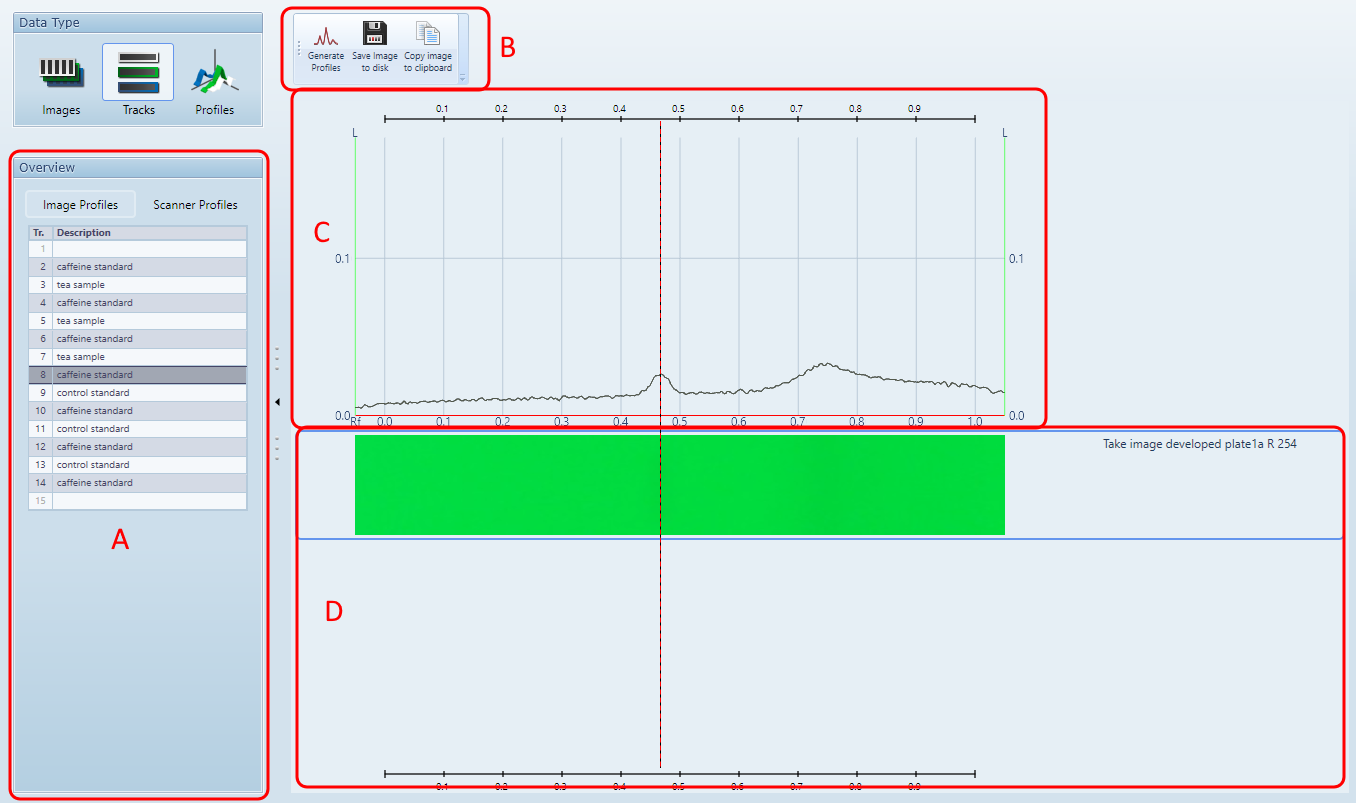
A Tracks sequence
Select the track to display in the grid. This will refresh the parts (C) and (D).
When Scanner Profiles is selected:
The (A) part displays a tree view where you can select a wavelength to display in (C) for the track selected. Use it to browse the track across the different plate states/wavelengths available.
The (D) part is hidden.
Profiles generated from Visualizer images are not displayed.
When Image Profiles is selected:
If the profiles has been generated from Visualizer step images, then the (C) part is displayed.
The (D) part is displayed.
B DataView Toolbar (limited)
C Profile of selected track at selected illumination, see Profiles viewer
A click on an RF scale (top of (C) or bottom of (D)) creates an RF line which can be useful to compare RF positions and absoption/luminance across different wavelength, illuminations and plate states. RF Lines are saved in the analysis.
D Track Image of selected track at all available illumination
The list of all track images, shown horizontally. A right click on an image allows you to export it to an image file.