New layout

To explain the template structure, we will modify the display of TLC Visualizer/TLC Visualizer 2 picture from one big image to a two columns with smaller images layout.

  1. If you don’t have an user template yet, please first duplicate an existing template (see Report templates).

  2. Then download it to an empty folder. You will get a file structure like in Report temporary files structure (expect that neither PDF file or index.html would be present).

    The Partials folder contains the template structure. The entry point is the file report.html, which redirect to the other partials.

  3. Edit the DataAcquisition\visualizerData.html file.

    A Handlebars for each (#each) is iterating over all images, and display one after the other. This will not work with a two columns layout. Therefore, we need to write a new iterator helper, which will tell us if the image is for the left or right column (ie: is the image count even or odd).

  4. In Helper folder, create a new file visualizer.js.

  5. Put the following code in it:

    'use strict';
    
    Handlebars.registerHelper('visualizerDoubleImagesForEach',
     function (context, options) {
         var out = '', data;
    
         if (options.data) {
                 data = Handlebars.createFrame(options.data);
         }
    
         var query = Enumerable.From(context)
                 .ToArray();
    
         for (var i = 0; i < query.length; i++) {
                 if (data) {
                         data.isEven = i % 2;
                         data.isOdd = !data.isEven;
                 }
                 out += options.fn(query[i], { data: data });
         }
         return out;
    });
    

    It is a standard Handlebars block iterator helper, we have just added isEven and isOdd properties to the metadata variable data.

  6. In DataAcquisition\visualizerData.html, we can now switch the #each with our new #visualizerDoubleImagesForEach. Don’t forget to also switch the closing of the block, from /each to /visualizerDoubleImagesForEach.

  7. To display on two columns, we need to add some CSS rules. Open Styles\main.css and add at the end:

    .image-flex-container {
        display: -webkit-box; /* wkhtmltopdf uses this one */
        display: -webkit-flex;
        display: flex;
        margin-bottom: 20px;
    }
    
    .image-flex-item {
        width: 48%;
    }
    
    .image-flex-separator {
        width: 4%;
    }
    

    We will use the CSS3 Flexbox feature. Please note that EO.Pdf don’t understand the current -webkit-flex, but the older -webkit-box.

  8. In the same file, we also need to reduce the size of the TLC Visualizer/TLC Visualizer 2’s images:

    .visualizerData > div.image > img { height: 150px; }
    
  9. Now we can finally change the layout in DataAcquisition\visualizerData.html, the whole iterator block should be like:

    {{#visualizerDoubleImagesForEach InstrumentDataModel.Images}}
       {{#if @isOdd}}
          <div class="image-flex-container">
       {{else}}
              <div class="image-flex-separator"/>
       {{/if}}
       <div class="image-flex-item">
              <div class="visualizerData">
                      <h4 class="toc hiddenTitle" toc-id="{{BookmarkId}}" toc-name="{{Illumination}} - {{DisplayName}}" toc-display="{{Illumination}} - {{DisplayName}}"/>
                      <div class="imageHeader">
                              <span class="headerLeft">{{Illumination}}</span>
                              <span class="headerRight">{{DisplayName}}</span>
                      </div>
                      <div class="image">
                              <img src="Images/Visualizer/{{ID}}.jpg"/>
                      </div>
                      <table class="reportTable propertiesTable">
                              <tr>
                                      <th scope="row">Exposure</th>
                                      <td>{{numberFormat ExposureTime 3}} s</td>
                              </tr>
                              <tr>
                                      <th scope="row">Contrast</th>
                                      <td>{{numberFormat Contrast}}</td>
                              </tr>
                              <tr>
                                      <th scope="row">Normalized exposure</th>
                                      <td>
                     {{#ifCond IsExposureNormalized true}}Enabled
                     {{else}}Disabled
                     {{/ifCond}}
                                      </td>
                              </tr>
                              <tr>
                                      <th scope="row">Clarify</th>
                                      <td>
                     {{#ifCond IsClaheActivated true}}Enabled
                     {{else}}Disabled
                     {{/ifCond}}
                                      </td>
                              </tr>
                              <tr>
                                      <th scope="row">White balance</th>
                                      <td>{{numberFormat RGain 2}}, {{numberFormat GGain 2}}, {{numberFormat BGain 2}}</td>
                              </tr>
                      </table>
              </div>
       </div>
       {{#if @isEven}}
       </div>
       {{/if}}
    {{/visualizerDoubleImagesForEach}}
    
  10. Upload the template in visionCATS and try it.

  11. Et voilà, we should now have a report like that:
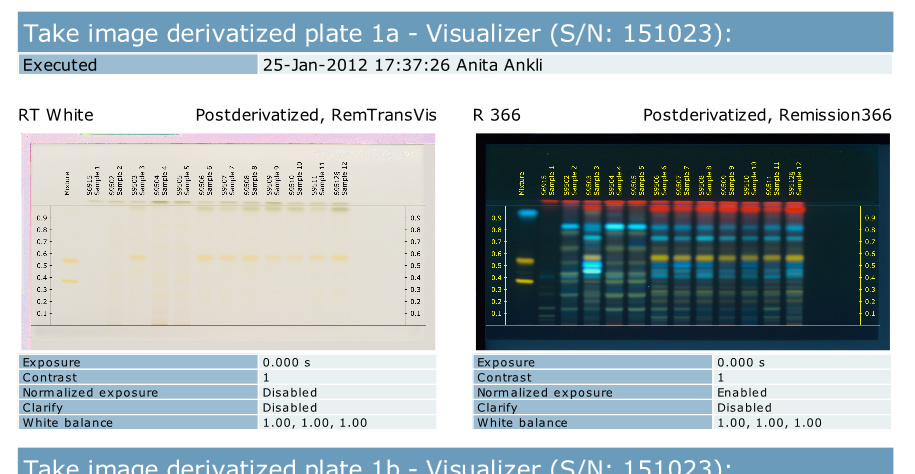
    ../../../../_images/doubleColumns.png