History tab
The History tab is a timeline view of the activity of the HPTLC PRO SYSTEM containing all the details related to the Line itself and the execution of the runs.
Functionalities
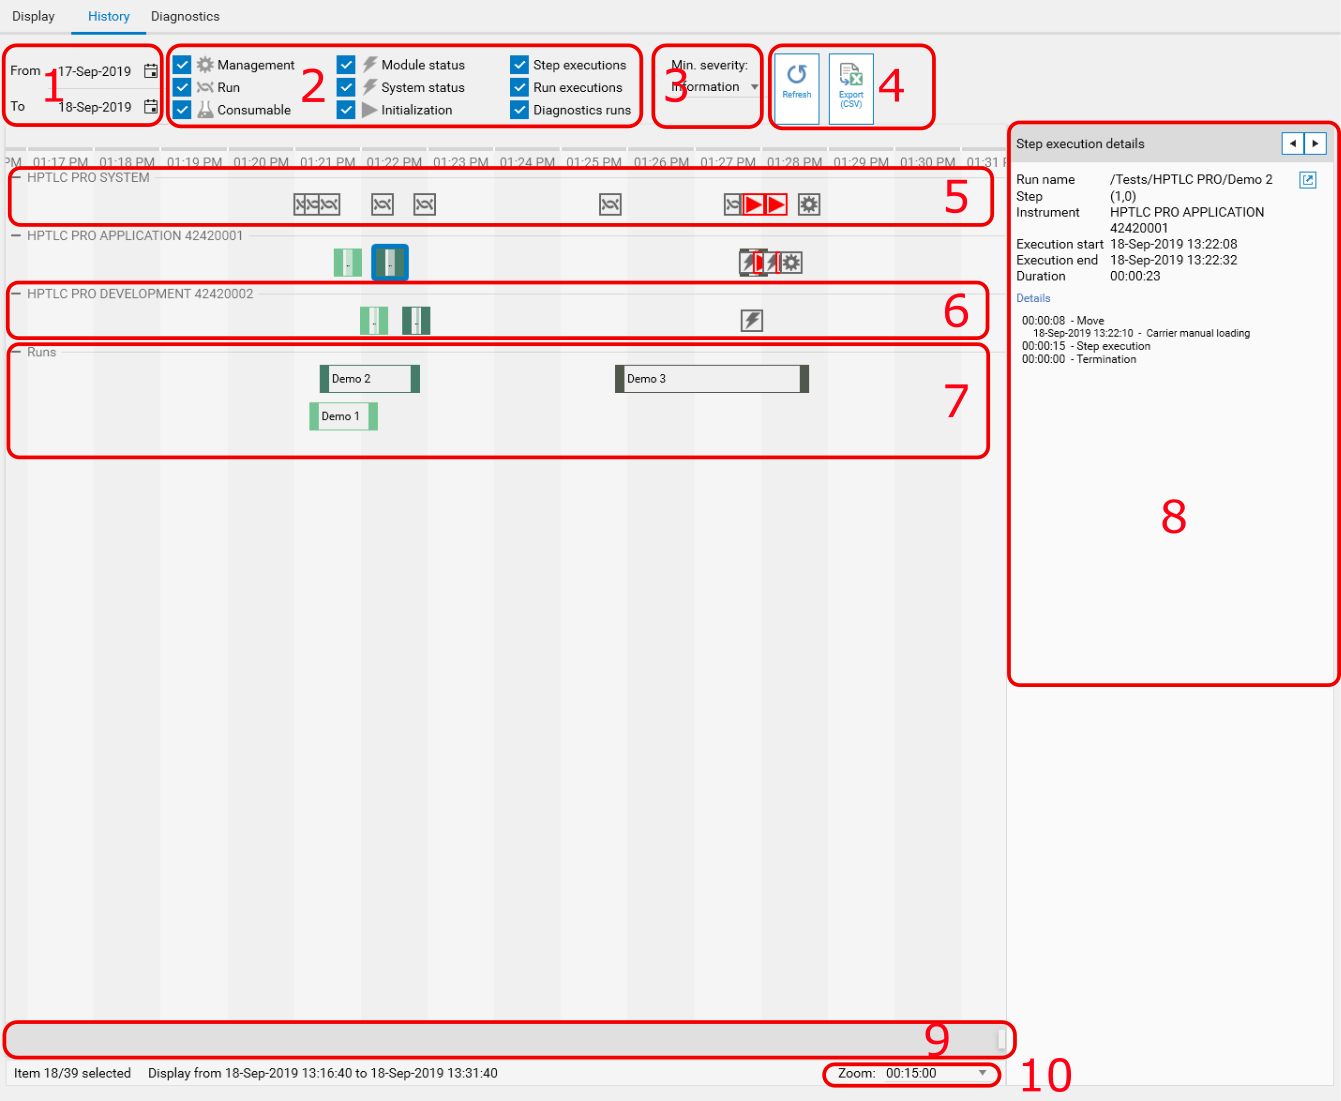
Selection of the date range to filter. By default, today and yesterday are selected.
Filter events by category. This shows/hides events and activity events.
Filter events by minimal severity. This shows/hides events and activity events.
Toolbar
The view is not refreshed automatically. Use the Refresh button to update the view manually.
Export the history as CSV file
Display of the events related to the line
Display of the events and the activities (move and step execution) related to a given instrument
Display of the runs executed on the line
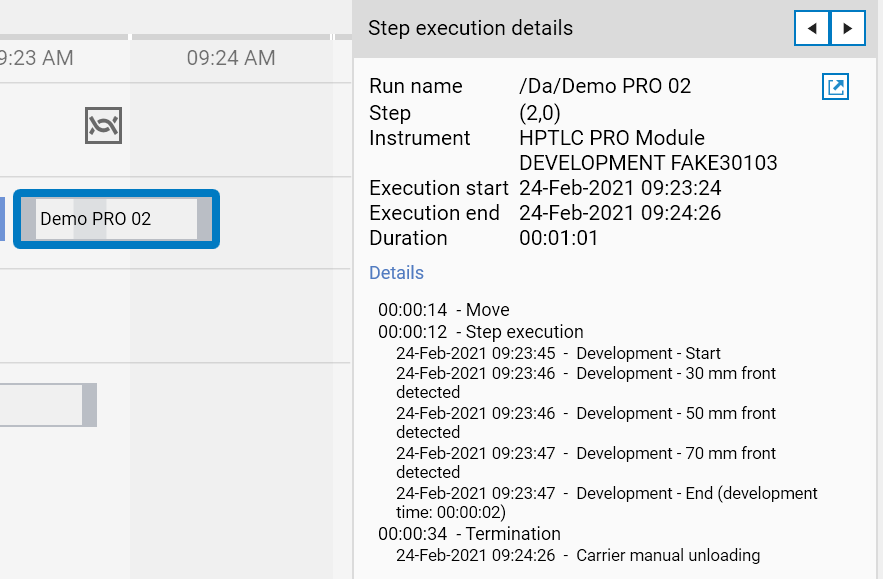
Details panel for the currently selected item (event or activity). It contains back/forward buttons to simplify the navigation.
Scroll bar to move the time interval being displayed inside the date filter chosen in 1).
Time interval being displayed horizontally.
Timeline groups
The timeline display is divided into several groups:
First, the HPTLC PRO SYSTEM group displays events related to the HPTLC PRO SYSTEM itself such as initialization errors, status changes or management events.
Then, there is a group for each HPTLC PRO Module of the HPTLC PRO SYSTEM. In each are displayed events related to the corresponding instrument and moves/execution of step in this instrument.
In the end, the Runs group displays the runs as a whole.
Types of elements
The timeline displays 2 types of elements:
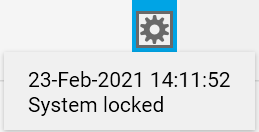
Events, happening at a given timestamp. They are represented by a square, such as in the following example:
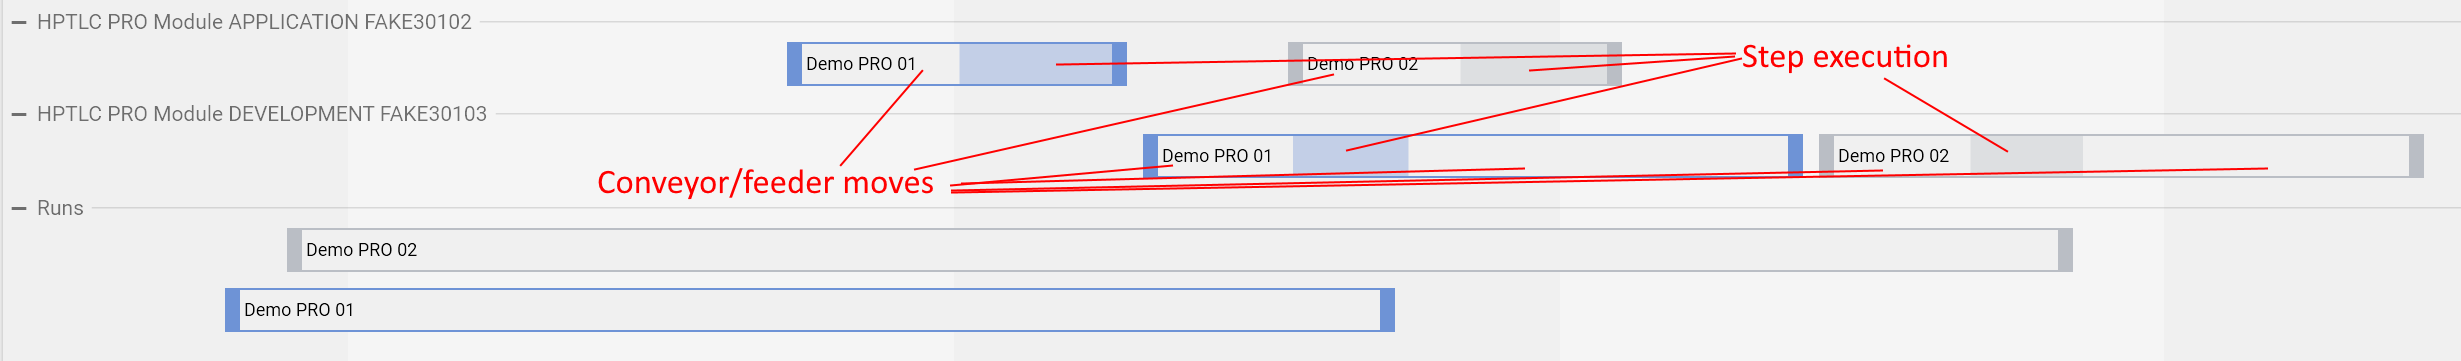
Activities, having a start and an end. This concerns the steps executed in HPTLC PRO Modules and the runs, as in the following example.
In the activities of HPTLC PRO Module, the background is partially opaque during the execution of the step. The other parts correspond to time interval where the carrier was moving to this instrument. In the following example, the run is considered finished when the execution of the step in the HPTLC PRO DEVELOPMENT was finished. The activity on the HPTLC PRO DEVELOPMENT lasts longer with a white background because of the ejection of the carrier.
Like in the Display tab, each run is associated with a color (green in the next capture). The corresponding activities on each instrument have the corresponding color, making it easy to follow visually the execution of the run across the instruments.
Activities also contain events. For example, when the HPTLC PRO DEVELOPMENT activity is selected, the right panel shows the carrier ejection event:
Event categories
A lot of different events can occur. In order to help the browsing through the history, several categories are defined:
 Management: such as HPTLC PRO SYSTEM enabled/disabled, HPTLC PRO SYSTEM renamed, etc.
 Run: concerns run’s event such as run start/end.
 Consumable: details the consumable changes.
 Instrument status: such as instrument connection/disconnection, warning/error received from instrument, etc.
 HPTLC PRO SYSTEM status: such as HPTLC PRO SYSTEM availability change or HPTLC PRO SYSTEM-related errors.
 Initialization: line-related or instrument-related initialization errors (therefore always red).
Severity
Depending on the event and on the context, each event is also associated with a severity, which corresponds to a color:
Information (grey)
Warning (orange)
Error (red)
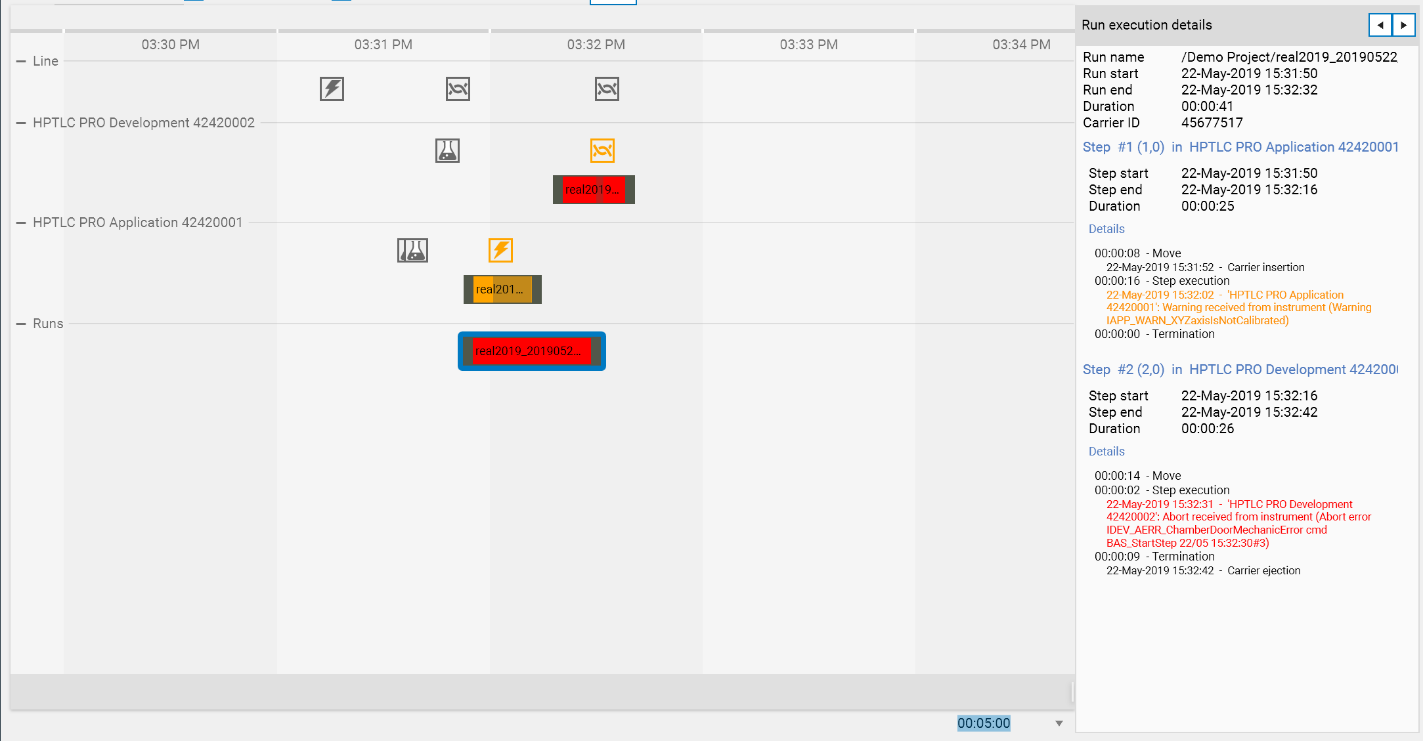
The following example shows a more complex situation where:
A warning occurred during the module APPLICATION step, which makes the activity appear as warning.
An abort error occurred during the module DEVELOPMENT step, which makes the activity appear as error.
As a result, the whole run appears as error.
The abort error events received are treated as warning at instrument level because the instrument itself can recover from such errors.
By selecting the run, the details of the events are displayed in the right panel