Internal standard
Overview
The Internal standard functionality allows you to correct peak heights/areas in an evaluation by:
Defining a substance of the evaluation as Internal standard. This internal standard should be defined on each track, have the same quantity applied across all tracks and be known to behave similarly to the other substances defined in the evaluation in order for the internal standard correction to make sense.
Computing, for each track, the deviation of the peak height/area of the internal standard on this track compared to the average peak height/area on reference tracks.
For each peak of each other substance, applying the inverse the deviation (i.e. correcting) computed for the track where the peak is assigned.
Defining the internal standard
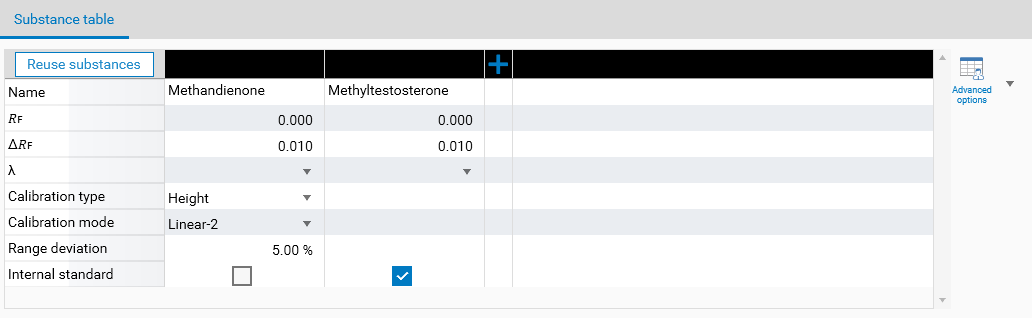
In the evaluation’s Definition tab, use the Advanced options button to make the Internal standard field appear. In an evaluation, there can be only one internal standard. Because the internal standard is not itself calibrated, its calibration-related fields are hidden.
During the calibration
During the Calibration phase, displaying the internal standard substance makes a table appear where the measured deviations are shown for each track.
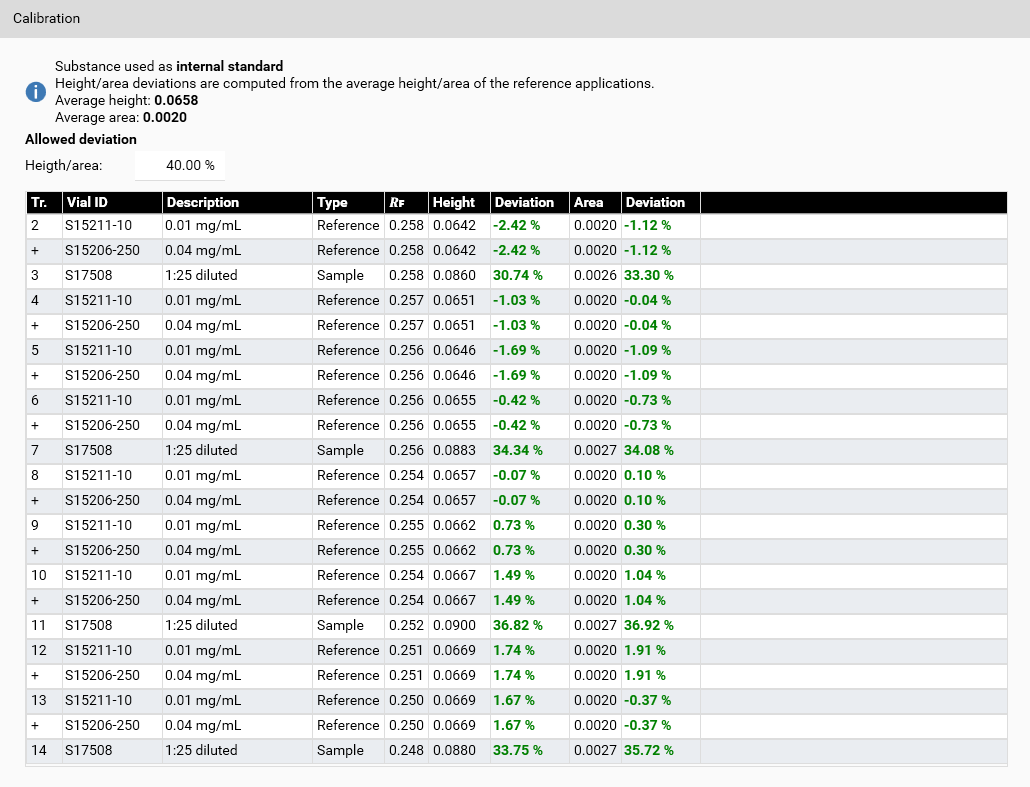
For each reference track (here, the tracks 1, 4 and 7), the average height and area of the assigned peaks for the internal standard are computed and shown on the top information box (here, 0.2688 and 0.0134 respectively). The Deviation columns show the relative difference of the peak height/area compared to the average peak/area. For example, the track 1 had a peak height of 0.2757, which is 2.55% bigger than the average height 0.2688. Therefore, all other assigned peak heights on track 1 should be corrected by -2.55%.
The Allowed deviation box defines a maximum deviation for the internal standard. If a deviation exceeds the limit, then the internal standard correction fails and no results are computed at all for the whole evaluation.
When displaying another substance, the tooltip gives the details of the internal standard correction:
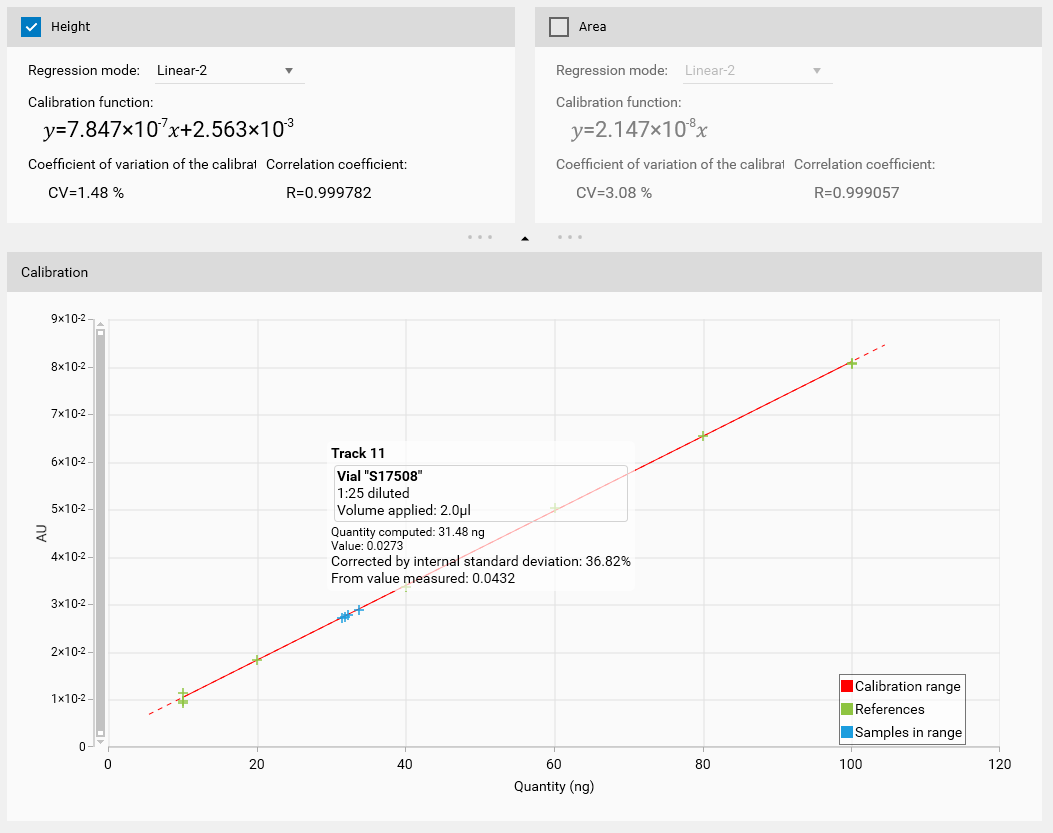
Here, the measured height of the peak was 0.3519, the correction to apply was -2.55%, therefore the peak height considered is 0.3429. Of course, the calibration curve is then computed by using the corrected reference points and the corrected sample points are used to deduct the resulting quantity and concentration.
In the results
The Results tab simply shows an information text indicating the correction with an internal standard, if any.