Spectrum comparison
Note
This tab shares many common functionalities with other tabs. See Common functionalities.
Note
This tab is only available on visionCATS installations having the Spectrum Scanning option.
Display
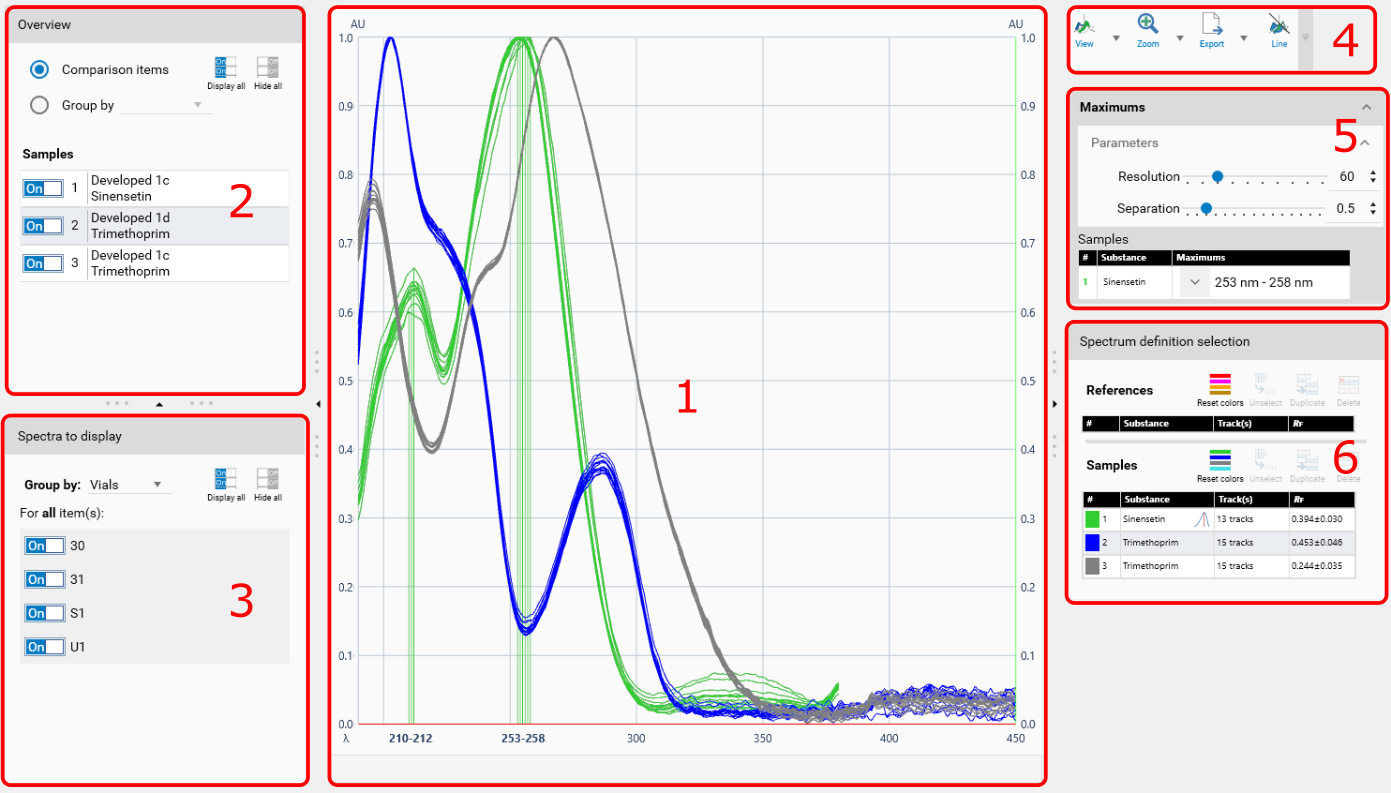
The main display uses the Profiles viewer in a similar way than the analysis’ spectrum Data view, and the coloring system is the same as the one used in the Profile comparison. However, some aspects are specific to this display:
Each item (displayed in the (1) and (6) lists) corresponds to a spectrum definition of the source analysis and is identified by a substance name. It contains one or more spectrum profiles (one for each track where the spectrum has been conducted for this substance in the source analysis). Therefore, each item is associated with a list of spectrum profiles, whereas in the Profile comparison each item always displays only 1 profile.
The wavelength range (x-axis) may differ between spectrum items (depending on the configuration of the spectrum scan step), therefore, some spectrum profiles displayed may not be defined across the full range displayed.
Overview
The overview section works the same way as the one displayed in Profile comparison and in Image comparison but, given the different nature of spectrum items, some grouping options are different:
Group by
Step
Group all items by their step name. Use this mode when comparing spectra coming from different analysis based on their plate state.
Substance
Group all items by their substance name. Use this mode to quickly compare one substance to others or to focus on the spectra available for a given substance.
Spectra to display
This section configures the spectrum effectively displayed in the main view (1).
Use the Display all/Hide all buttons to quickly configure the spectrum profiles to display.
When exactly one item is displayed or selected, the section automatically groups by tracks where a spectrum profile is available for this item:
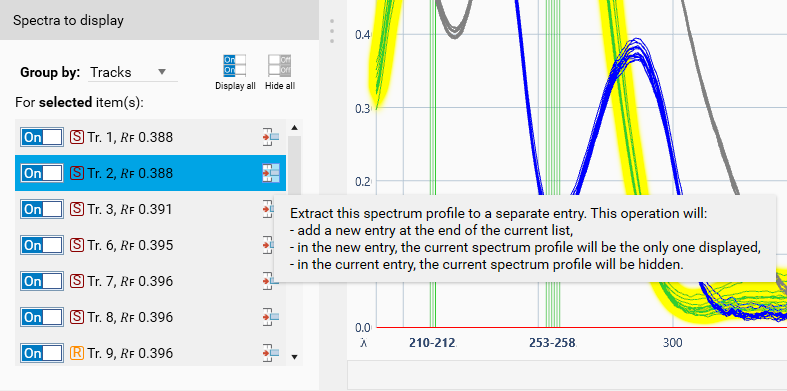
Each spectrum profile can be displayed or hidden by using the corresponding On/Off toggle button.
For each track, the original reference/sample info is displayed, as well as the 𝑅ꜰ position of the spectrum.
There is an additional Extract function which goal is to quickly display the extracted item in a separate entry. Use this function to focus the comparison on a specific spectrum profile in the list.
When several items are displayed or selected, the section offers only the following grouping options:
Vials
Display/hide spectrum profiles based on the vial IDs of the tracks where the spectra have been performed. Use this mode to see the vials of the spectra currently displayed or selected and to focus on specific vials.
Sample
Display/hide spectrum profiles based on the sample descriptions of the track where the spectra have been performed. Use this mode when the sample descriptions of the analysis Track Assignment are used to distinguish specific elements.
Toolbar
The toolbar shows a combination of elements coming from:
The Profiles viewer for the display preferences of spectrum profiles,
The buttons related to the Common functionalities, also present in the comparison image’s Toolbar.
Maximums
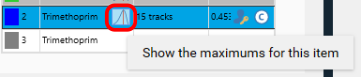
The analysis’ spectrum Data view contains a Maximums display option available in this view too. The maximums are detected by using the same parameters (Resolution and Separation). The default values for this parameters should be appropriate in most of the cases. To display the maximums associated with an item, hover this item in the Spectrum definition selection (6) section and click on the corresponding icon:
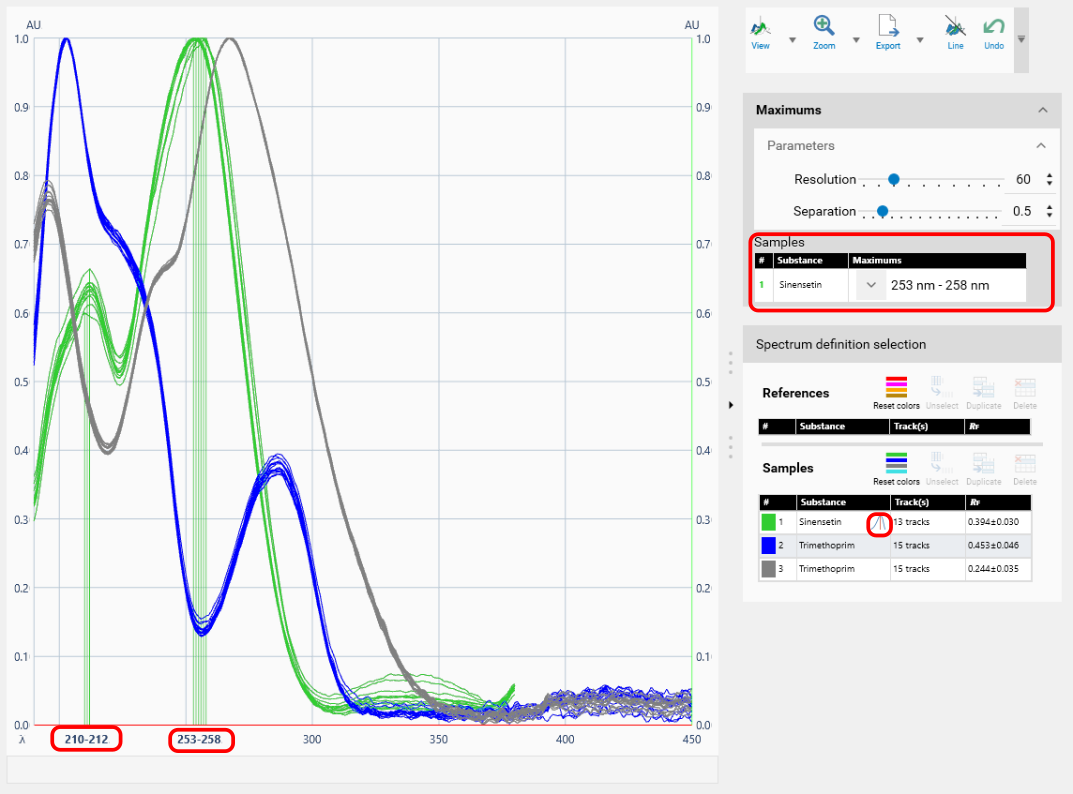
When maximums are displayed for an item, the icon stays fixed on the item in the Spectrum definition selection (6) section, the corresponding maximums are detailed in the grid inside the Maximums (5) section and the maximums are shown in the Display (1) view (vertical lines and maximum wavelengths displayed in the X-Axis in bold).
Spectrum definition selection
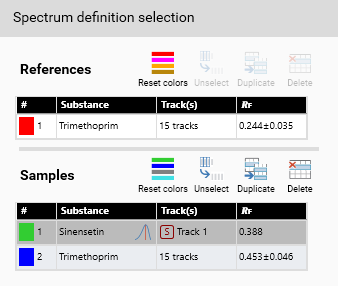
This section is very similar to the comparison profiles’s Profile selection section. The only differences are:
Given the different nature of spectrum profiles items, the Vial and Sample fields are replaced with the Track(s) and 𝑅ꜰ fields respectively.
When there’s only one spectrum displayed for an item, the track number, reference/sample information and 𝑅ꜰ position of the spectrum are displayed directly.
When several spectra are displayed for an item, the number of tracks and the 𝑅ꜰ range is displayed.
When no spectrum is displayed, a warning appears for this track.
The addition of the Maximums functionality.