Integration
In integration, you can refine the data, and detect peaks.
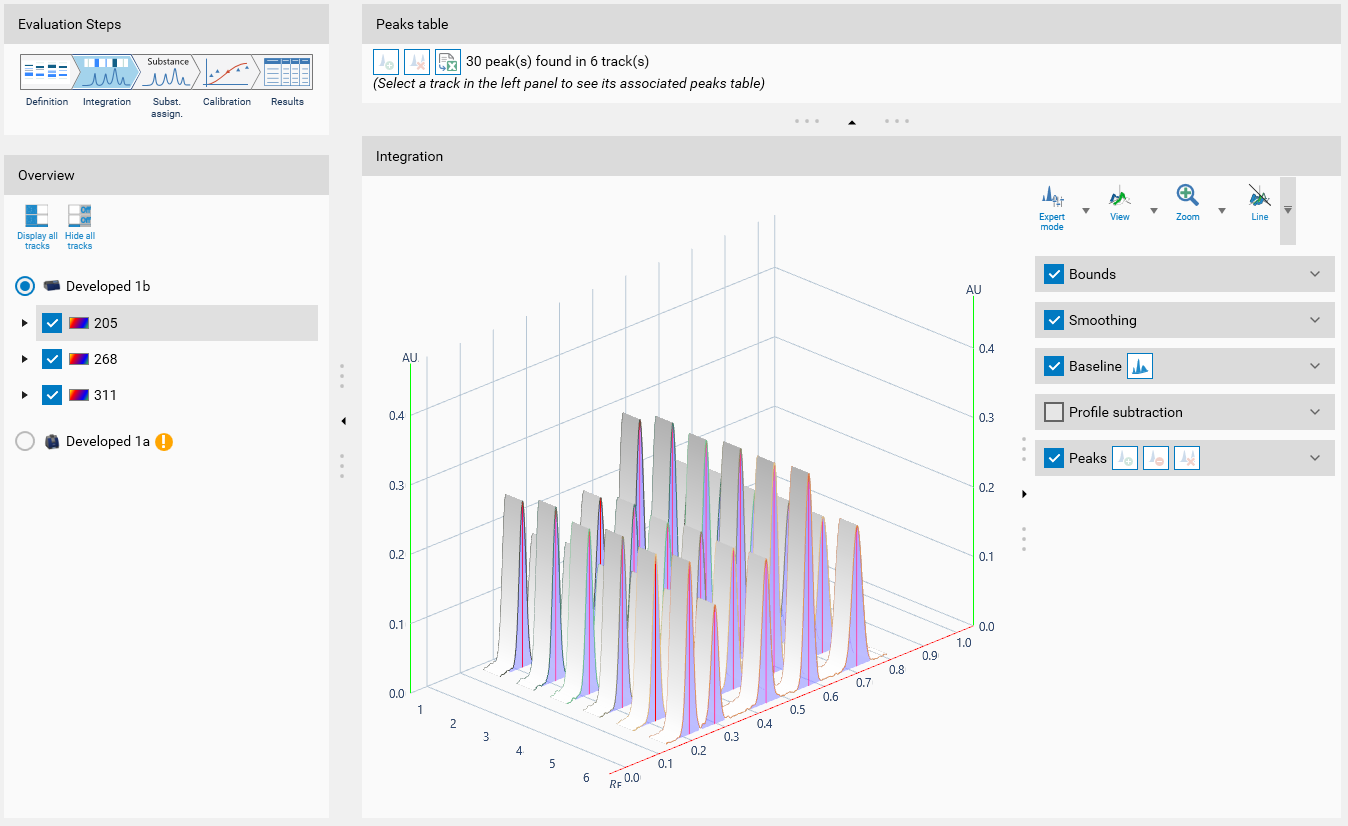
The view is made of three main parts:
Overview (left)
Peaks table (top)
Profiles view (bottom)
Integration tools (bottom right)
Overview
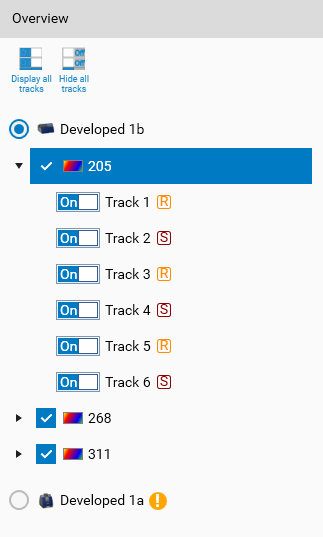
It displays all your profiles data as a tree, ordered by HPTLC step / instrument and by wavelength (or illumination). You can select which step and wavelength you want to use in the evaluation.
Note
It is only possible to select one HPTLC step / instrument
If you need to use two or more steps, you should create new evaluation’s tabs for the other steps.
You can either select a whole HPTLC step / instrument, or only some of the wavelengths.
Important
Only selected data will be available in the next evaluation steps.
It is also possible to hide a specific track by switching the corresponding button from  to
to 
Note
For TLC Visualizer/TLC Visualizer 2 steps, you need first to generate profile data in Data View, and if not already done, the step will be marked with  .
.
To the right of the track number, the type of sequence is displayed,  for reference and
  for sample. The icons have tooltips displaying the application in details.
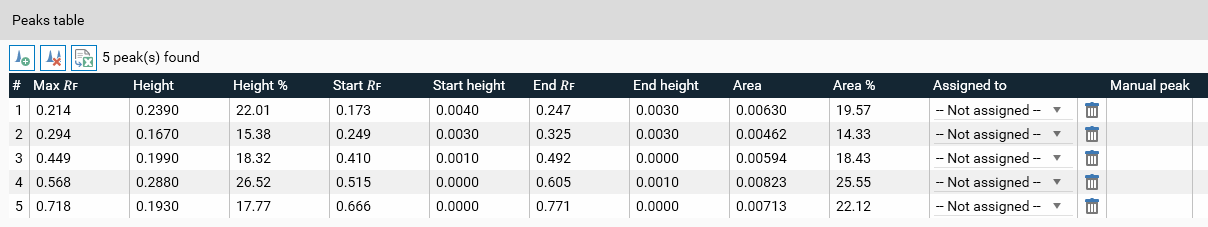
Peaks table
The peaks table has 2 modes:
When a single track is selected in the Overview, all the characteristics of the peaks of this track are displayed:
Note
The peak table displays positions in 𝑅ꜰ or millimeter unit depending on the mode currently activated in the Profiles view.
Max 𝑅ꜰ or Max pos. (mm): the 𝑅ꜰ/mm position where the maximum height was found
Height: the maximum height of the peak
Height %: the height of the peak relative to the sum of the heights of all peaks detected for this track
Start 𝑅ꜰ or Start pos. (mm): the start 𝑅ꜰ/mm position of the peak
Start Height: the height at the start 𝑅ꜰ position
End 𝑅ꜰ or End pos. (mm): the end 𝑅ꜰ/mm position of the peak
End Height: the height at the end 𝑅ꜰ position
Area: the area of peak (obtained by discrete integration of all the profile points between Start 𝑅ꜰ and End 𝑅ꜰ)
Area %: the area of the peak relative to the sum of the areas of all peaks detected for this track
Assigned to: this field displays a combo box used to see and configure the substance associated to the peak. The combo box allows you to delete an existing assignment (– Not assigned – option), choose a substance already defined in the evaluation, or create a new substance (– Create substance – option). In this last case, the substance will have a generic name by default, modifiable in Definition.
 : delete the peak (see Manual peak edition)
Manual peak: indicates whether the peak has been manually edited or not (see Manual peak edition)
On top of the peaks table, some peak-related actions are available (see Manual peak edition):
 Add a new peak,
 Delete all peaks of the current track.
 When a step or a wavelength is selected in the Overview, the peaks table only shows the number of peaks detected and also a CSV export button. The CSV export contains a simple table containing the following fields for each detected peak:
Wavelength or illumination,
The track number,
All the fields displayed when a track is selected in Overview.
Note about numbers range and significant digits
𝑅ꜰ is by definition in the range [0;1].
Absorbance, fluorescence and luminance are in arbitrary unit (AU), and the raw range depend of the instrument sensor and the quality requested. Therefore, each measure should be normalized to the same range. Contrary to previous software, the range used by visionCATS is the more common one of [0;1], same as for 𝑅ꜰ. The normalization range is arbitrary and will not affect results.
Significant digits of values are reduced for a more concise display, but all computations are done with the full precision available.
Important
If you need to do additional computations with these data, it is recommend to use the CSV export function to get values with maximal precision.
Note
The same value precision is available in the Report data, and therefore it is possible to create a report template with more significant digits (see Report templates).
Profiles view
The Profiles viewer can be used here in both 2D and 3D. Single tracks are available in 2D only.
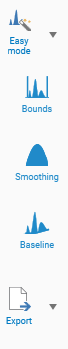
Integration tools
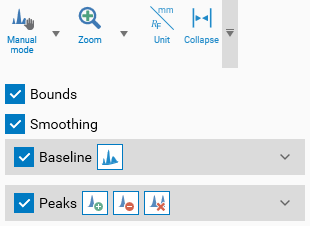
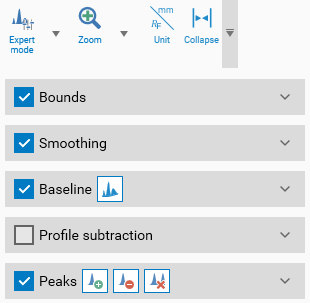
On the right, you have the different integration tools. Different modes allow the settings of expert parameters:

Easy : the main integration tools can be activated/deactivated but not configured, and the peak table is not shown. Use this mode when the default integration parameters work well.

Manual : advanced baseline and peak detection features are enabled, and the peak table is shown. Use this mode to perform the integration manually.

Expert : all available features are accessible. Use this mode to configure advanced features such as smoothing parameters and dual wavelength.
Note
The default mode can be selected in User Options, see Default integration mode .
Bounds
Bounds will allow you to only use the data between the start and end bound (in 𝑅ꜰ unit).
Clip outside: will also hide data outside the bounds
Smoothing
Profile raw data usually have some noise, which can adversely affect the peak detection. With smoothing, you can remove this noise.
Savitzky Golay (SG)
Moving average (MA)
Gauss
For each algorithm, a window or width can be adjusted to specify the amount of noise filtered.
Baseline
Most plates don’t have a perfect background, therefore you should remove this baseline for better results.
You can display the detected baseline with the button  .
.
Lower slope (LS): Automatic baseline detection, works on most data
Profile Subtraction
In some cases, profile subtraction can be interesting as another option to correct profile and/or an alternative to baseline correction. visionCATS offers two modes:
Dual Wavelength: select a base wavelength in the combo box. Each track of the base wavelength will be subtracted from the tracks of other wavelengths in the step currently selected.
Track: select a base track in the combobox. For each wavelength, the values of the base track will be subtracted from the other tracks.
Peaks
Optional Quadratic Interpolation (OQI)
Gauss (Legacy): the implementation of Gauss peak detection as it was in visionCATS 2.4 and previous versions.
Gauss: the new and optimized version of the gauss peak detection, starting with visionCATS 2.5.
Peak detection can be adjusted with the Separation, Sensitivity and Threshold parameters.
Also, peaks can be manually adjusted with Manual peak edition.