Display Options
In this view, you can change how some specific user interface elements are displayed. If you have User Management activated, these options become user specific options. Each user will see its own set.
Method and analysis options
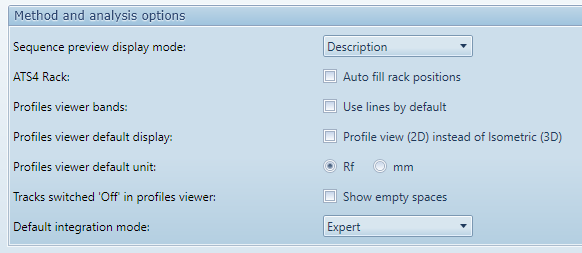
Sequence preview display mode : when displaying the sequence table Preview view in the Main explorer view or in the Chromatography tab of an analysis, the vial and/or description can be displayed for each track.
ATS4 Rack : when editing the Sample Sequence in an analysis having at least one ATS4 instrument step, the rack positions can be filled automatically for each used vial, from A1 to A11, then B1 to B11, etc.
Profiles viewer bands : in analysis (Profiles View, Integration and Data) and comparisons (Profile comparison and Spectrum comparison), the Profiles viewer can show each profile as a band or as a line. This option allows you to change the mode displayed by default, knowing that each Profiles viewer is associated with a toolbar where you can change this mode on the fly.
Profiles viewer default display : in analysis (Profiles View, Integration) and Profile comparison, the Profiles viewer has many display modes. This option will set the default display mode to Isometric (3D) or Profile (2D) knowing that you can then manually change the display mode in each Profiles viewer. This option does not affect the spectrum views (Data and Spectrum comparison), where the default display mode is always Profile (2D).
Profiles viewer default unit : in analysis (Profiles View, Integration), the Profiles viewer can display the X-Axis positions either in Rf or millimeter unit. This parameter is not applicable to spectrum views (wavelength in nanometer) and to the Profile comparison (always displayed in Rf unit because the physical position vary between plates).
Tracks switched ‘Off’ in profiles viewer : in analysis (Profiles View, Integration), the Profiles viewer can show empty spaces for tracks switched ‘Off’. By inserting empty spaces, the overall layout of the plate is kept (except that tracks not applied don’t appear) which may make the view more understandable, but the view may be filled with almost only empty space when switching ‘On’ only a few tracks. This does not apply to other 3D views.
Default integration mode : The Integration view has 3 modes designed to present the right amount of complexity and options depending on the usage.
Easy : the main integration tools can be activated/deactivated but not configured, and the peak table is not shown. Use this mode when the default integration parameters work well.
Manual : advanced baseline and peak detection features are enabled, and the peak table is shown. Use this mode to perform the integration manually.
Expert : all available features are accessible. Use this mode to configure advanced features such as smoothing parameters and dual wavelength.
Dialogs options
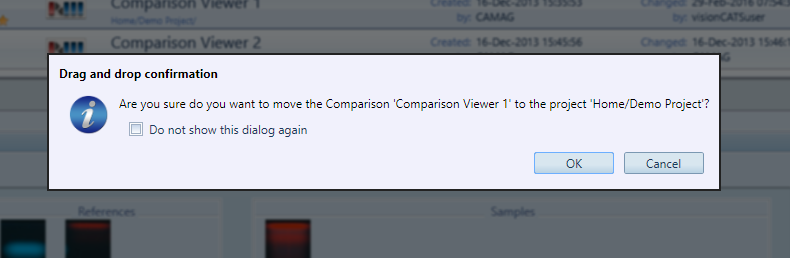
visionCATS uses a dialog boxes system to provide immediate and “blocking” information or to request an immediate decision (Yes/No dialogs). Some dialog boxes can appear often, making them annoying for the expert user. In these cases, a Do not show this dialog again check box can be checked to prevent the message box from reappearing the next time this action occurs. For example, when dragging/dropping an item in Main explorer view:
The Dialogs options section allows each user to manage this feature:
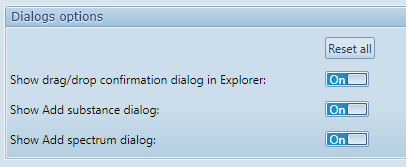
Reset all : Set all dialog boxes to “On”, making them reappear if they were hidden.
Show drag/drop confirmation dialog in Explorer (example above) : This confirmation dialog appears when moving items by using drag/drop in Main explorer view, in order to prevent accidental operations.
Show Add substance dialog : This information dialog appears in Substance assignment when adding a new substance by clicking on a peak.
Show Add spectrum dialog : This information dialog appears in scanner manual control view, when adding a spectrum to perform.
CSV export options
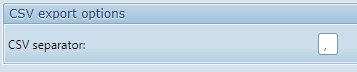
CSV separator : Set the character inserted between each field when exporting to CSV. This is useful when other software expect input CSV data with a specific separator.