Calibration
After having:
defined the substances and their concentrations in the Definition tab and
assigned the substances to their corresponding peaks in the Subst. Assign. tab,
use the Calibration tab to configure and see the regression functions used to compute the quantity of each substance in the sample applications, based on the reference applications.
For each vial applied as reference with a given volume on a track, the substance concentration the vial contains (as defined in the Definition tab) gives the quantity X of substance applied. Depending on the current calibration parameters, the height or the area of the peak is considered as Y value to produce a reference point of coordinates (X,Y). 2 reference vials applied with the same volume are considered as replicas, because in errorless conditions the 2 applications should produce the same reference point. The regression function Y=F(X) is computed by taking each center of gravity of reference points’ replicas as input data, and by applying the algorithm corresponding to the calibration mode chosen.
For each vial applied as sample having a peak assigned to the substance being quantified, the peak height or area gives an Y value, and its corresponding quantity X is computed by resolving X=InvF(Y) where InvF is the inverse of the function F.
Note
In case of reference overspotting of the same vial, the sum of the quantities produce the reference point. When mixing reference and sample overspots of vials containing a quantified substance, the reference and sample quantities applied on the track produce 2 different points (one reference point and one sample point).
Overview
The Overview section contains the following functionalities:
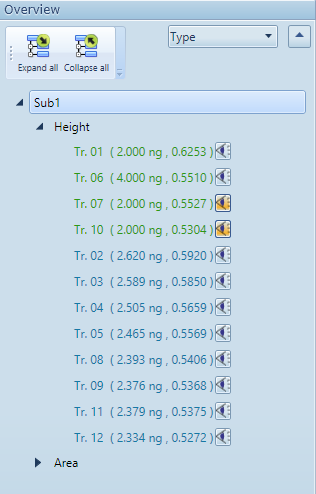
Display all the quantities given (for reference application) or computed (for sample applications), and the peak’s height and area,
Select the substance to be displayed in the other sections,
Highlight individual points by clicking on the corresponding icon next to each point,
Note
Inside the Height and Area nodes, each item is a calibration point corresponding to a vial application. Consequently, you may have many calibration points on the same track if the track has overspots. No calibration point will be found if a reference application’s vial does not have any concentration/purity defined for the current substance.
Additionally, this section contains some usual tree manipulation and sorting features.
When a substance is selected, the main area is refreshed accordingly:
Height/Area views
Note
This section is in read-only mode when displaying a related substance (see Related Substances)
In this section, 2 parameters can be configured:
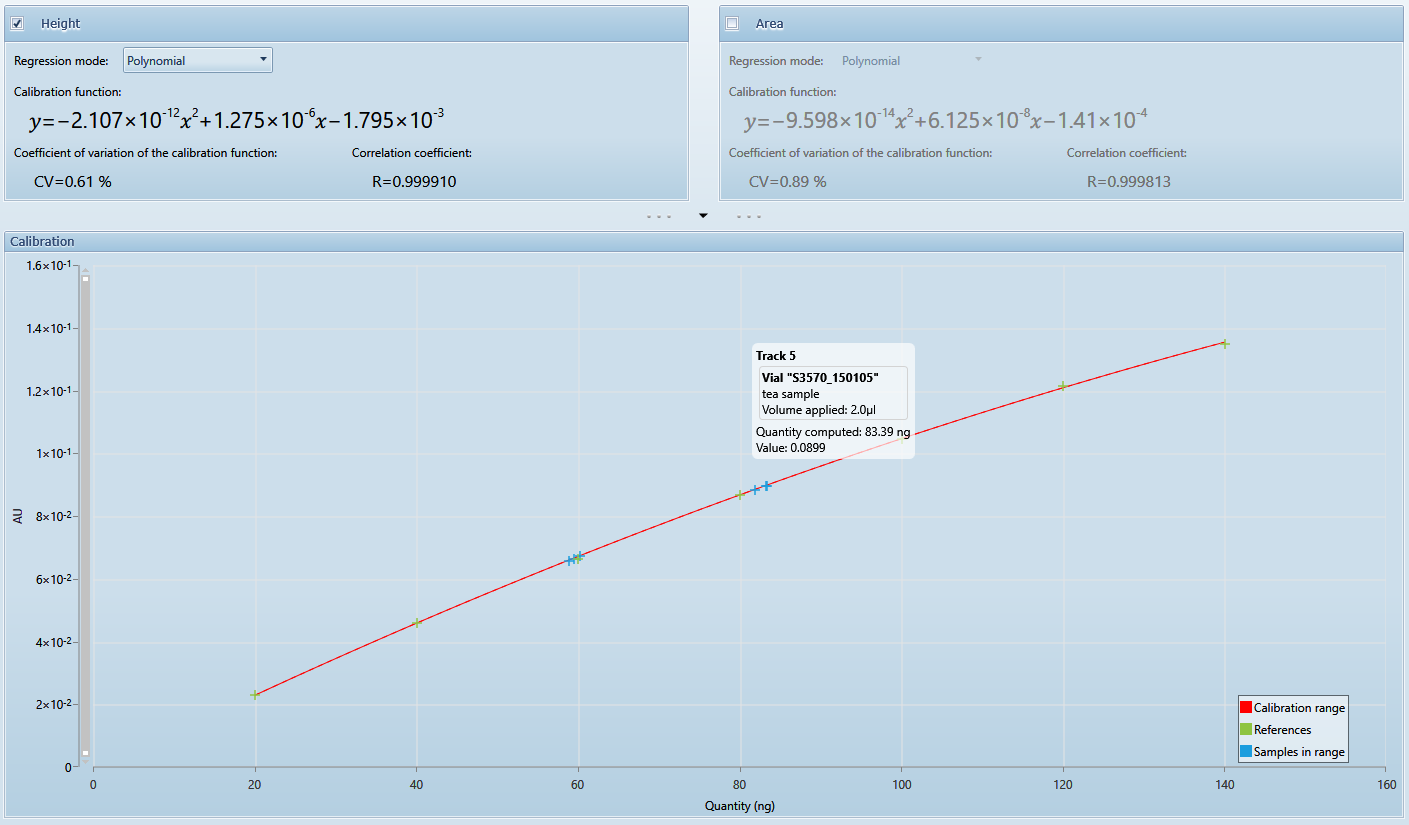
The calibration type (Height or Area, understood as “height/area of the peaks”, see Peaks table).
The calibration mode, by choosing between the list of available regression functions:
Linear-1: the calibration curve is the linear function going through the origin and the center of gravity of the reference points.
Linear-2: the calibration curve is the best linear function for all the reference points.
Polynom: the calibration curve is the best 2nd degree polynom for all the reference points.
Mime-1: the calibration curve is computed by an iterative process (Michaelis-Menten) giving a saturation curve going though the origin.
Mime-2: the calibration curve is computed by an iterative process (Michaelis-Menten) giving a saturation curve.
Note
This 2 parameters can be configured in the Definition tab too.
This section also displays the regression function itself, its coefficient of variation (this is an indication of deviation between the regression function and the reference points used to compute it) and its correlation coefficient.
Note
In the regression function, x is always expressed in the pico unit prefix, because it has to be unit-independent. The display of the curve in the bottom area does not follow this rule, in order to display more user-friendly values.
Please note that many situations prevent the calibration from giving results:
There aren’t any reference or sample assignments (sample points are kept only in the range of the reference points quantities, except for the Linear-1 mode) for this substance,
There aren’t enough replicas group (Linear-1 requires 1 replicas group, Linear-2 and Mime-1 require 2 replicas groups, Polynomial and Mime-2 require 3 replicas groups),
The regression function computed is not strictly increasing in the range of the reference quantities,
In case of Polynom regression, if the second derivative of the function is positive
In case of Mime regressions, the iterative process diverges.
When using the Internal standard functionality whose allowed deviation is exceeded.
Note
Using internal standard with non-linear regression mode will result in a warning
Calibration function view
This area gives a visual feedback of the calibration by showing the calibration curve, the reference points and the sample points in the same chart. The chart zoom can be controlled by using the mouse wheel or a selection rectangle. When hovering the mouse on a reference or sample point, the tooltip displays the details of its associated data:
The corresponding track,
The detail of the vial application(s) corresponding to the point, with the vial ID, description and volume applied,
The exact coordinates of the point.
It is possible to export the calibration chart by right-clicking on it. In the exported image, the user can choose the resolution of the image and choose whether to export the legend.
Note
Sample points are not displayed in case of a main substance (see Related Substances)
Note
In case of the substance being defined as internal standard, the display changes (see Internal standard)