Debugging the report template
If you are modifying or creating a report template, it is possible that it will not render as expected at first. You will need to debug the template to locate and then correct the issue.
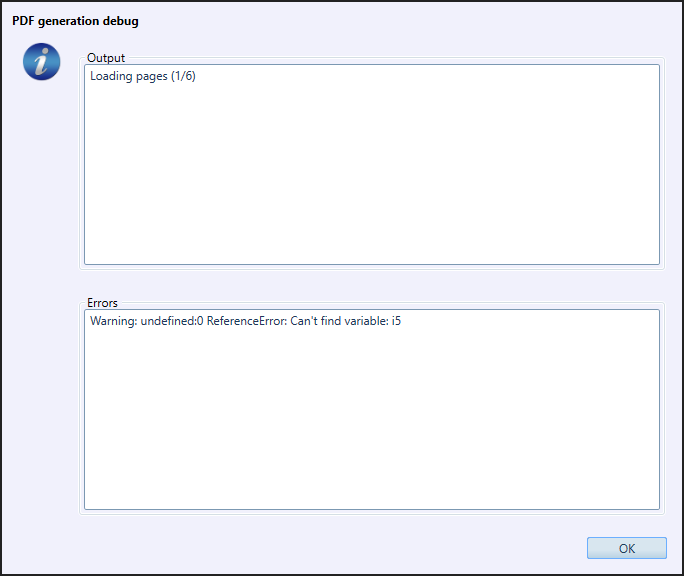
PDF generation debug
If the report is blank and/or it is taking a very long time (limited to 1 minute), the conversion from HTML to PDF had some troubles.
You can see the log of the generation with the button  in the toolbar of the Report tab.
PDF generation temporary folder
All the files needed to render the final report (PDF file) are put inside a temporary folder.
It is even possible to display and debug the HTML file used for creating the report.
Click on  button to open the folder.
Report temporary files structure
The exact files will depend of the report template, but the basic structure will remain:
index.pdf: the final report fileindex.html: the main HTML file, which you should open in a Web browser for debuggingoverlay.html: the overlay HTML file, containing headers and footersImages: folder with all images (data images like pictures from TLC Visualizer, and images specific to the template)Partials: folder containing any partial Handlebars template file (during rendering, the HTML files are converted in JavaScript (.js) files).Scripts: folder containing all the JavaScript specific codeconfig.js: global code, like Handlebars helpers (template specific helpers are copied there)main.js: the template specific code (like Flot plots)data.js: all the data in JavaScript format, see Code editor for viewing itdatah.js: a lightweight data file with just the needed data for the header and footer
Styles: folder containing the CSS filesmain.css: the template specific styles
Warning
As visionCATS need to transform SCSS files to CSS, no sub folder is supported in
Styles.
Debugging tools
Web browser developer tools
Firefox, Chrome and Edge have all a developer tools function, accessible via 
All have similar tabs:
Inspector/Elements/DOM explorer will display the rendered HTML code. It is possible to see the CSS style of each element.
Console will list any error.
Debugger/Sources will display all the JavaScript code, and permit to debug it.
For reference, please see Firefox Developer Tools, Chrome DevTools or Edge F12 Dev Tools.
Code editor
The free Notepad++ is recommended for modifying or creating the template.
Notepad++ is particularly useful for reading the data.js file, with the help of the JSTool plugin. To install the plugin: and then select JSTool and install it.
To make the data readable, from the opened data.js, do .
With Notepad++, you can then collapse the different arrays in data to easily find the wanted data.