Profile comparison
Note
This tab shares many common functionalities with other tabs. See Common functionalities.
Note
This tab is only available on visionCATS installations having the Scanner Quantification Package or the Visualizer Enhanced Evaluation Package options.
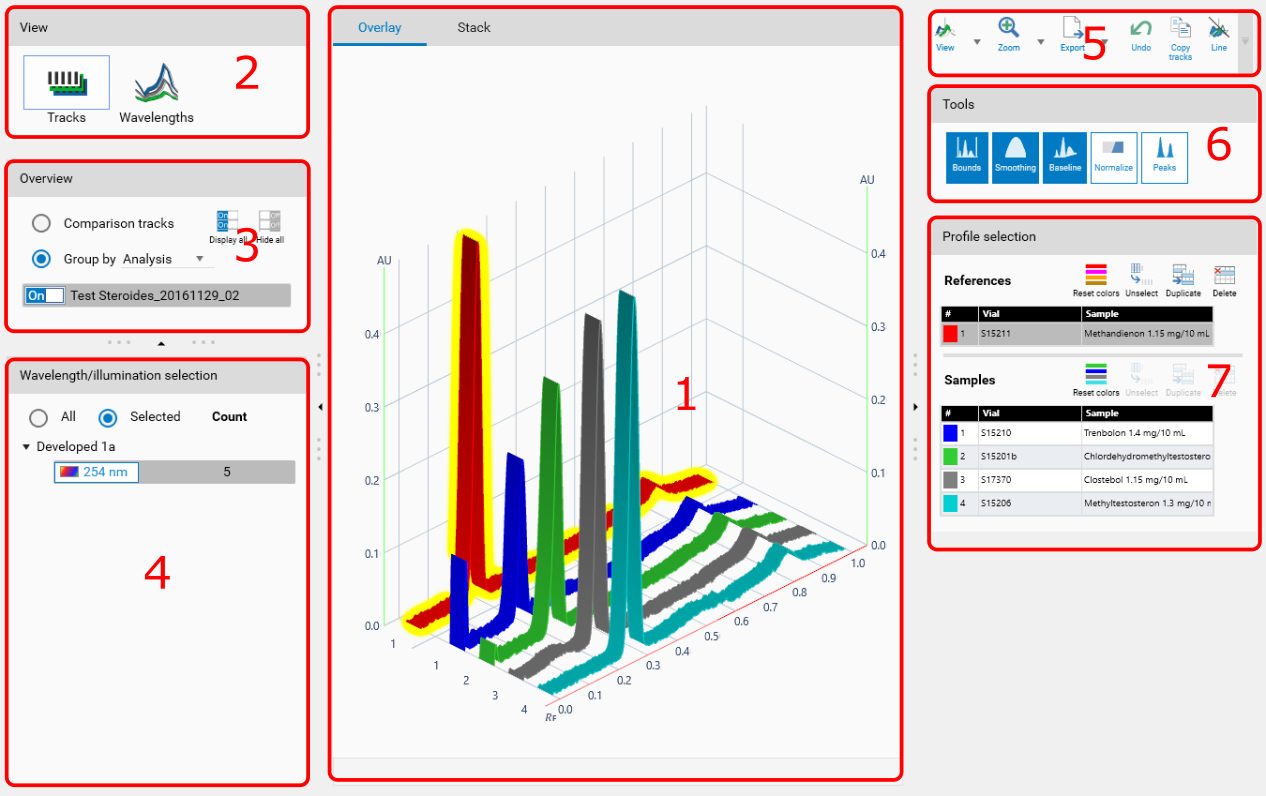
Choose between Tracks view and Wavelengths view
Tracks view
This is the default view, where one track displayed corresponds to one track exported from the source analysis. Use this mode to compare track profiles coming from different analysis.
Display
The display of the tracks is available either in overlay mode (all tracks displayed in the same 3D view) or in stack mode (lists where each track is displayed separately). The overlay mode displays a 3D view where the tracks are on top of each other in profile mode. While this is appropriate to compare some profiles, it tends to be very difficult when a lot of profiles are displayed. In this case the stack mode is often more appropriate, and its 𝑅ꜰ scale/lines functionality allows to compare 𝑅ꜰ positions more accurately. In both cases, it’s possible to:
Select/unselect items by clicking on them,
Display additional information about a track in a tooltip by hovering it (similar to the comparison image Track information).
Overlay
The overlay view uses the Profiles viewer.
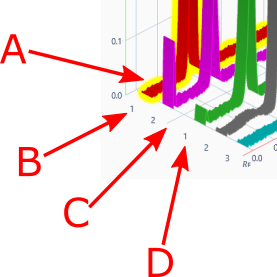
A: Selected profiles have a yellow glow around them.
B: First reference profile.
C: Reference/sample delimiter.
D: First sample profile.
Stack
The stack view is similar to the comparison images view Display, except for its orientation (vertical instead of horizontal).
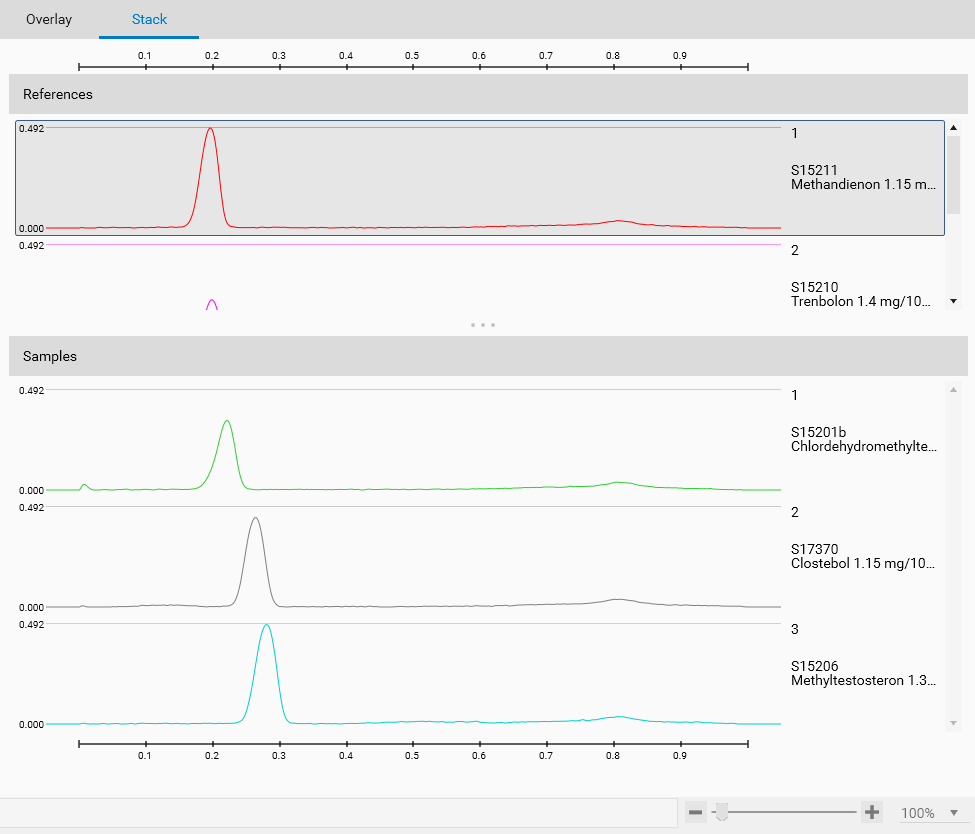
It provides the following functionalities:
Display in flip mode, as explained in the Toolbar section.
Move the splitter in the middle and, by right-clicking on it, set it to the middle of the view.
Zoom vertically to change the height of each profile displayed.
Click on the 𝑅ꜰ scales to place 𝑅ꜰ lines.
Overview
This view is the same as the one in the comparison image tab, but for profile tracks (see Overview).
Note
As the references and samples lists are already displayed in the Profile selection section, the Overview section is grouped by analysis by default instead of displaying the Comparison tracks.
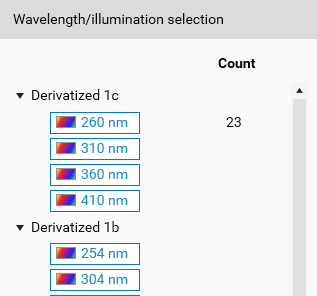
Wavelength or illumination selection
This view is similar to the comparison image view Illumination selection, except that the tree shows the available wavelengths as well as the illuminations.
Toolbar
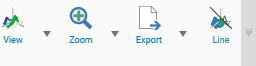
The toolbar contains:
Buttons coming from the Profiles viewer, used for the manipulation of the 3D view.
The buttons related to the Common functionalities, also present in the comparison image Toolbar.
 For the Stack view, the flip mode flips vertically the samples profiles and sets the zoom so that one reference and one sample profile appear in the view.
This is intended to be used to perform mirror comparisons.
For the Stack view, the flip mode flips vertically the samples profiles and sets the zoom so that one reference and one sample profile appear in the view.
This is intended to be used to perform mirror comparisons.
Tools
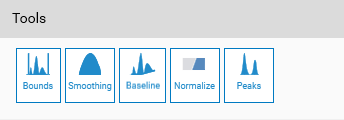
The tools are similar to the ones in Integration tools, but only available in the easy mode (on/off).
Bounds
Smoothing
Baseline: only Lower Slope (see Baseline in analysis evaluations) is available in comparison
Normalize: each track will be normalized to the maximum value of its analysis reference track (set in Profiles viewer, by default track 1)
Peaks: Display the maximum 𝑅ꜰ line, and for selected tracks the maximum value
Note
the Normalize tool applies the same normalization as the one in the Profiles View of the analysis. Therefore, a comparison track will be normalized by the normalization range defined in the source analysis at the time the tracks were exported to the comparison.
Profile selection
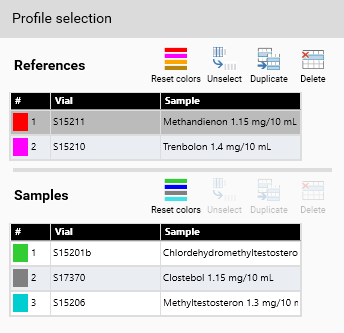
The displayed tracks are listed here, grouped by reference and sample.
Profile selection toolbar
 Reset the color of each track of reference or sample group, based on the 4 default colors and the index of the tracks
 Unselect all tracks of the list
 Duplicate selected tracks in the list
 Delete selected tracks in the list
Profile selection lists
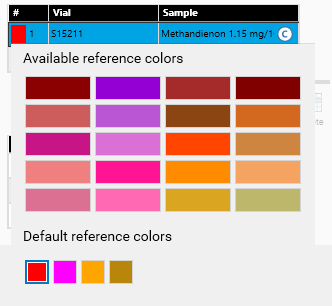
Each track displays
its color. The references and samples lists use two distinct color palettes, each one has 4 default colors. The references color palette contains warm colors while the samples color palette contains cold ones, in order for the visual separation to be clear. By clicking on the color rectangle of an item, it’s possible to change the color:
its number inside the group.
the vial ID.
the sample description.
Each track can be individually selected or unselected.
Selected tracks can be moved inside the same list or to the other with a drag&drop.
Copyright and e-signature functions are accessible when hovering an item.
Hovering an item displays additional information about it (similar to the comparison image Track information).
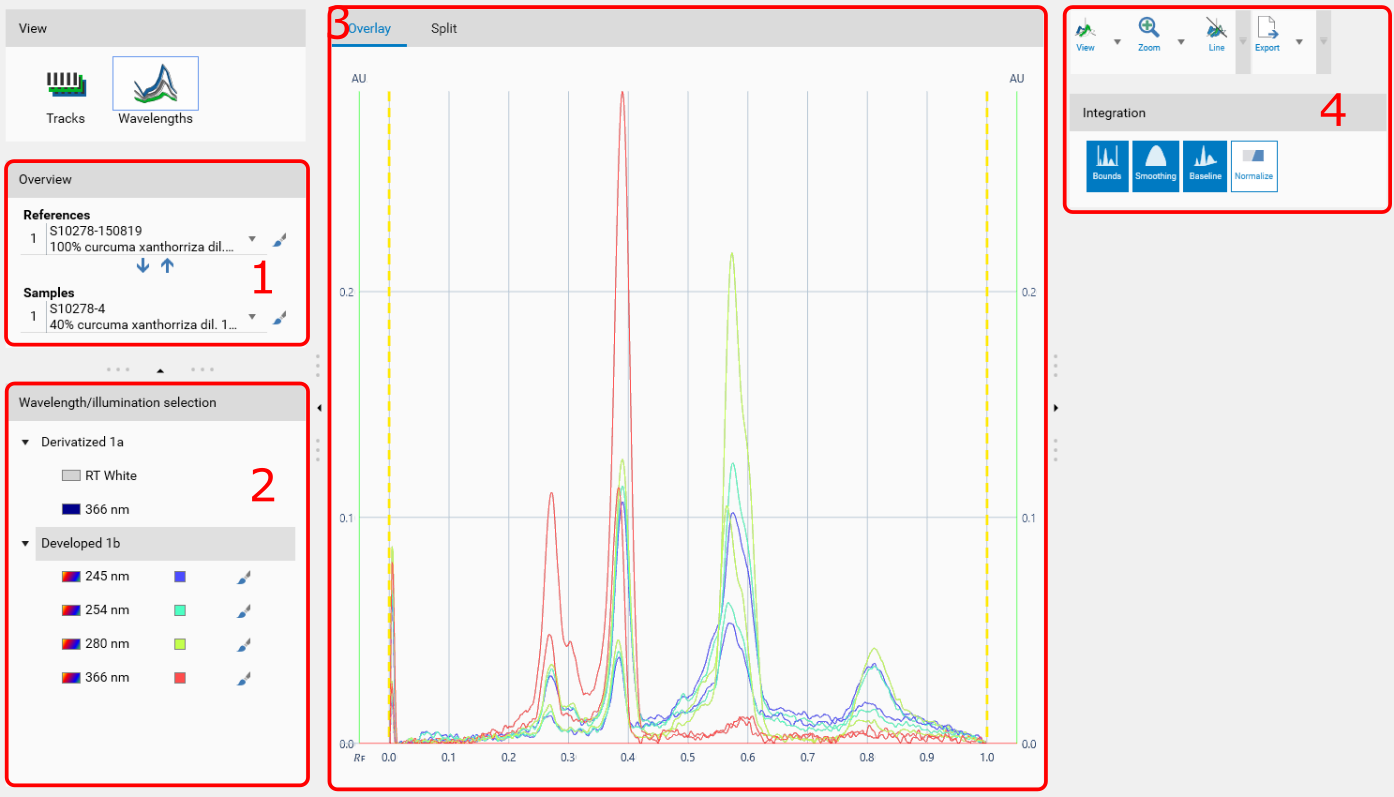
Wavelengths view
Use the Wavelengths mode to perform multi-wavelength comparison of 2 given tracks.
Begin by selecting a reference track and a sample track.
Use the
and
to move tracks from/to the references/samples list. It is the same operation as dragging/dropping a track between the 2 lists in the Tracks view. Use this function in conjunction with the combo box selection to quickly place and select the 2 tracks to compare.
Use the
button to highlight all profiles of the corresponding track. Use this function to identify the reference or the sample profiles in the main view.
Select a step in the tree. VisionCATS assigns a color for each wavelength. Use the
button to highlight the 2 corresponding profiles to compare.
Note
There is no link between the color of a profile in the Tracks view and in the Wavelengths view.
The main view, available in Overlay and Split modes.
Overlay: use this mode to see all the profiles of the 2 tracks in the same graph. This way, you can visually identify the differences (peaks positions, heights) between the 2 tracks for each wavelength. The overlay view uses the Profiles viewer.
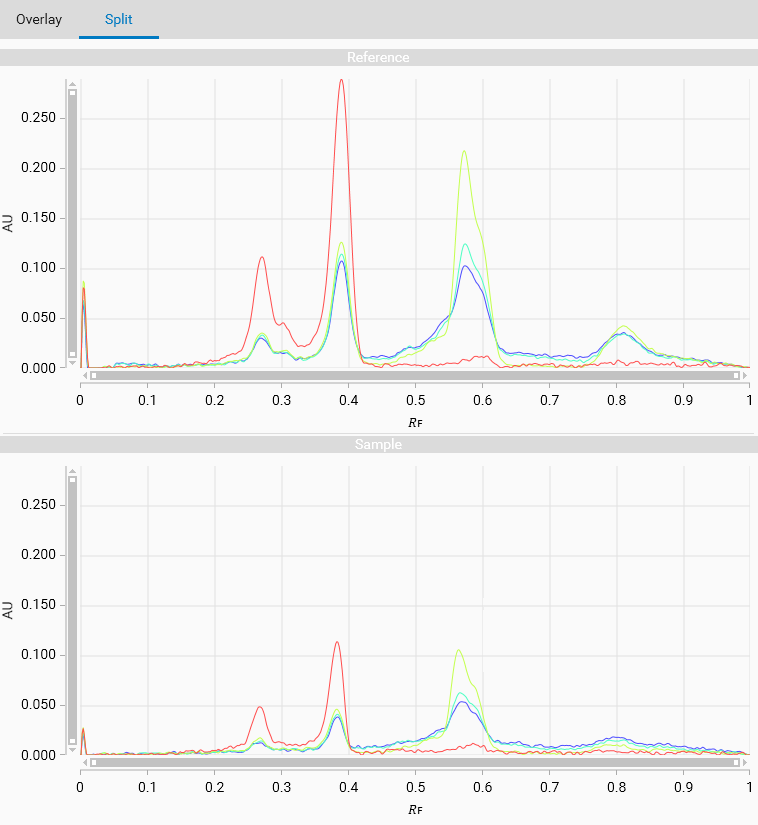
Split: use this mode to see the profiles of the 2 tracks in 2 distinct graphs. This way, you can compare the evolution of the profiles between the reference track and the sample track. These 2D views have zoom and help crosshair capabilities.
The tools contain globally the same functions as in the Tracks view: easy/expert modes, undo/redo support, export as image function and integration tools.