Report
Note
For the general configuration of the reports, please refer to Reports Configuration, and for a full explanation of how the report templates work, please see Report templating.
The goal of the Report tab is to produce printable documents representing the analysis or the method. The flexibility of the functionality allows the user to choose the data to display in the report and how the report looks like.
The report itself is a PDF file, loaded or refreshed when the user goes to the Report tab. It is possible to cancel the loading and to hit the Refresh button to reload it manually.
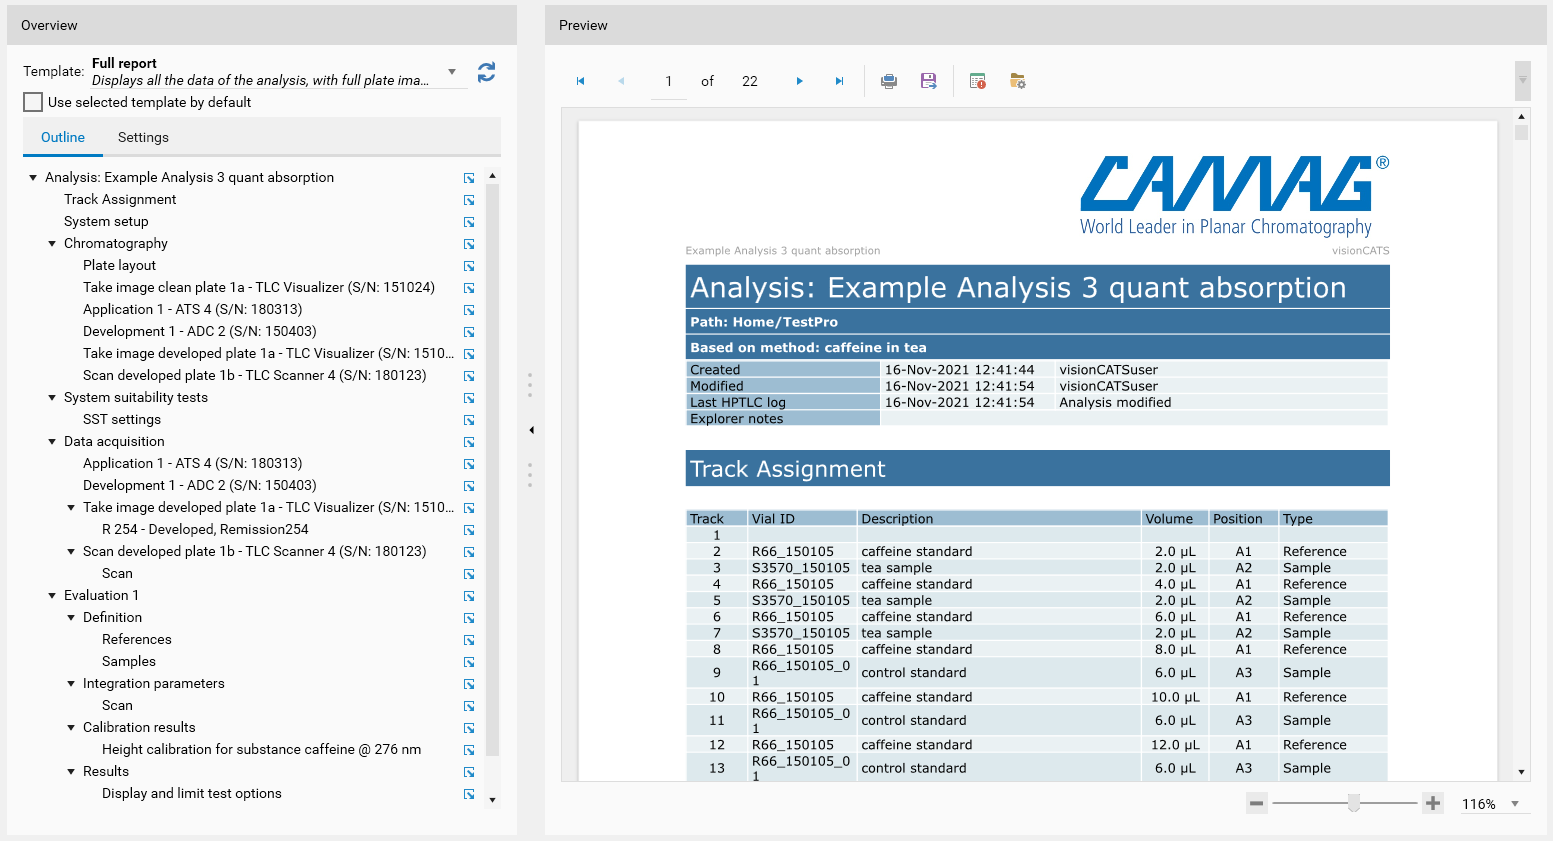
Overview: configure the report template, the settings and navigate through the report outline
Preview: the report itself
Warning
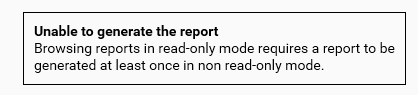
The display of the report is based on report parameters (as explained in the next sections) which are generated automatically the first time the report is displayed. These parameters are saved along with the method/analysis file itself. By definition, if the method/analysis file is read-only, initial report parameters cannot be saved. Consequently, it is necessary to compute and display the report at least one time for each method/analysis before setting it read-only. Otherwise, the following message appears:
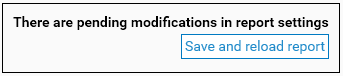
In the following sections, all actions performing a change in the method/analysis file make the currently displayed report obsolete. The report preview is therefore replaced with the following message:
Report Settings
Report template selection
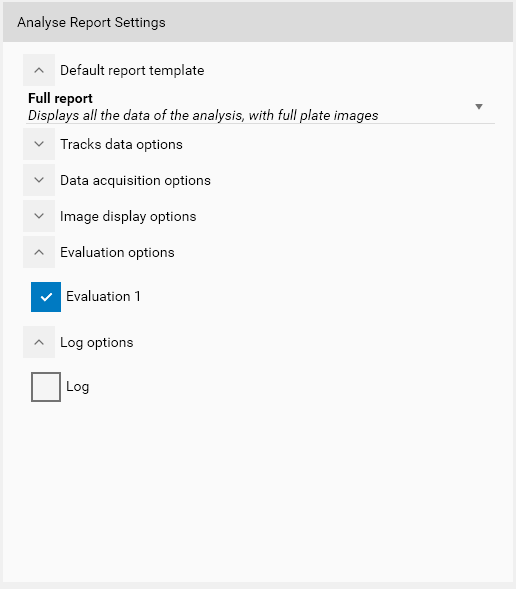
Choose here the report template to load. The combo box shows the available report templates, built-in or not, depending on the current templates available in Report templates. visionCATS provides the following built-in analysis report templates:
Full report : this report displays all the data of the analysis (Track Assignment, steps, data acquisition, spectrum, SST, evaluation, signature), similarly to the full report of visionCATS 2.3. Full plate images are shown but not sample images.
Sample report : this report is a modified version of the sample report of visionCATS 2.3. It displays all the sections like the full plate report, with the exception of the data acquisition, where tracks are grouped by sample ID (vial ID) names and sample images are shown instead of full plate images.
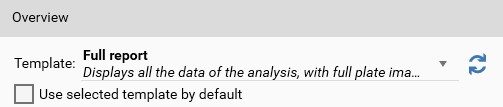
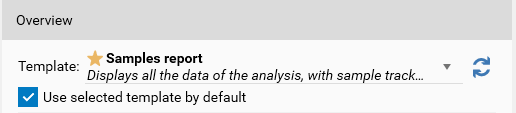
In the list of templates available in Report templates, there is always a template being the Default one. This template is displayed by default and is always generated again on-the-fly, unless the Use selected template by default is checked. In the following capture, the Sample report was set as default template:
This overwrites the default template being displayed and saves the generated report which will not require anymore to be generated on-the-fly when going to the Report tab. The saved report will be kept unless new changes are made to the file.
Note
Combining the read-only flag on the file, and the Use selected template by default option, ensures that the generated report will not change (fixed contents, generation date and Id).
Report template options
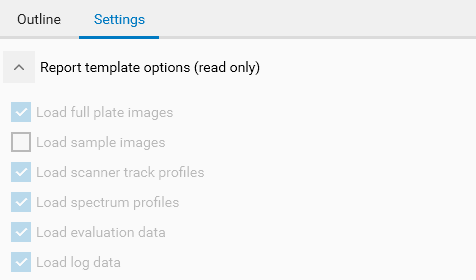
This read-only section recalls the report template input parameters defined in Report templates section of the general settings. Depending on the options selected and the analysis itself, the report can take more or less time to load.
Tracks data options
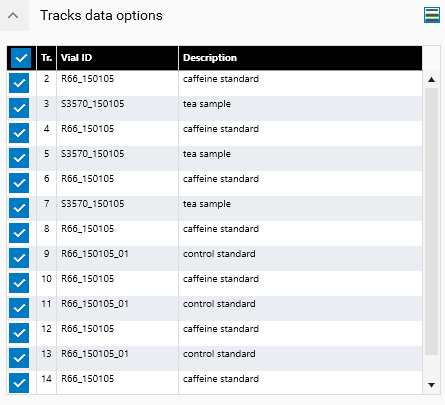
In this section, the user can choose for which tracks the data has to be loaded. When a track is selected, visionCATS will load:
Its sample images (for the images selected in Data acquisition options and if the Load sample images report template option is checked)
Its track profiles (for the wavelengths selected in Data acquisition options and if the Load scanner track profiles report template option is checked)
Its spectra (for the substances definitions selected in Data acquisition options and if the Load spectrum profiles report template option is checked)
Its corrected track profiles in the evaluation(s) of the analysis (for the evaluation(s) selected in Evaluation options and if the Load evaluation data report template option is checked)
The section also has a samples  mode, in which the selection of a track will also select the other tracks having the same vial ID. Use this option to produce sample-oriented reports.
By the way, the checkbox in the header of the grid performs a select all/hide all operation.
Data acquisition options
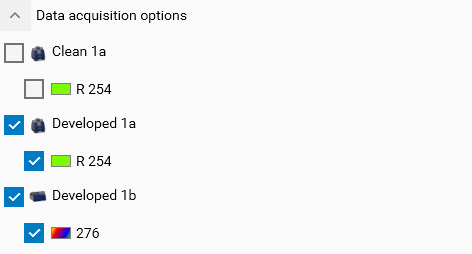
With this section, the user can choose which data acquisition steps, images, track profiles and spectra to load. In the tree view:
Image steps will only appear if the Load full plate images or the Load sample images report template option is checked
Profile steps will only appear if the Load scanner track profiles option is checked
Spectrum steps will only appear if the Load spectrum profiles option is checked
Clean documentation steps are unchecked by default.
Image display options
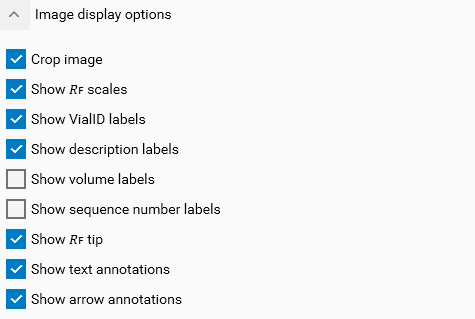
This section is only displayed if the Load full plate images report template option is checked. By the way, the options in this section are for the display only; they are not saved in the analysis. The options provided correspond to the ones available in the Images View of the analysis.
Evaluation options
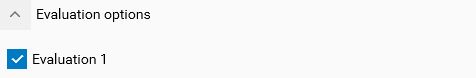
This section is only displayed if the Load evaluation data report template option is checked. It allows the user to select which evaluation to load.
Log options
Note
This section is only available on visionCATS installations where the 21 CFR Part 11 Compliance option is active.
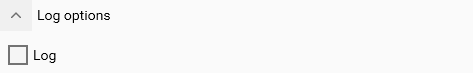
This section is only displayed if the Load log data report template option is checked. It allows the user to load the HPTLC Logger tree.
Note
In the built-in Full report template, the Load log data option is checked, but the Log option is unchecked by default in analysis. It means that, by default, the contents of the HPTLC Logger are available but not displayed.
Outline
The tree view displays the PDF outline of the report. As explained in the Heading and report overview section, the PDF outline can be entirely configured and the text displayed in the tree can differs from the corresponding header text in the report.
Use the  button next to each entry to navigate to the corresponding element in the report.
Preview
In this part, you will see the preview of the PDF report.

The toolbar provides navigation and print/export functionalities:
 Go to first page
 Go to previous page
Go to a specific page
Total number of pages
 Go to next page
 Go to last page
 Print
Print Export: Export and save the report as PDF
 and
and  Debug tools: see Debugging the report template
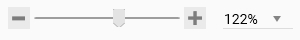
At the bottom, you can change the zoom level of the preview.
Method report
The report in method is very similar to the analysis one, expect that of course measured data and results are missing.
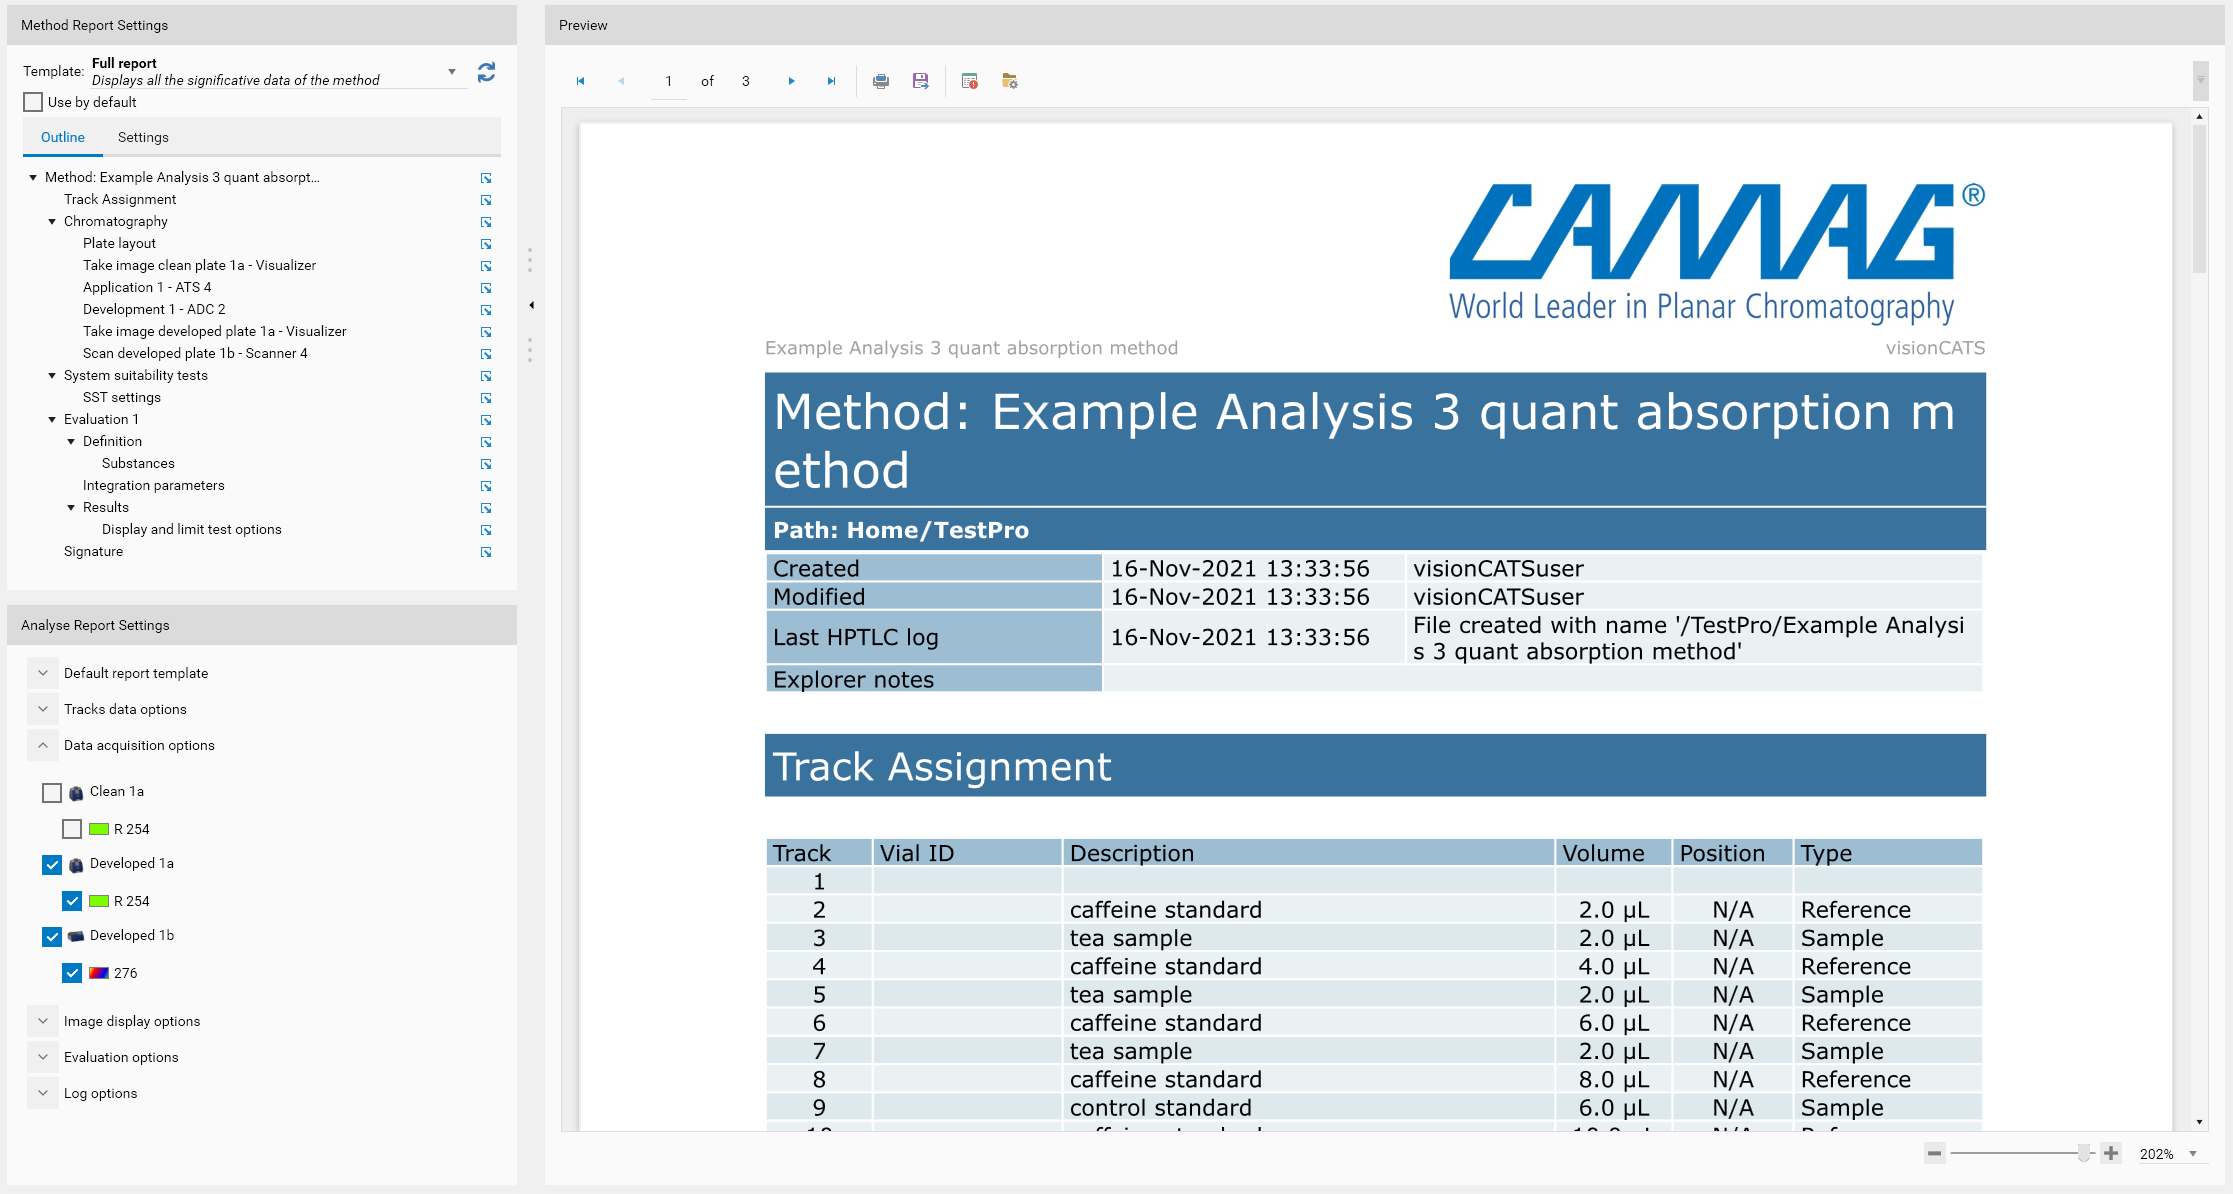
But it is also possible to select the template and configure the settings for any analysis executed from the current method. This way, the analysis executed from the method can be preconfigured to display an appropriate report.
Warning
Don’t confuse between Method Report Settings and Analysis Report Settings. Method Report Settings is for the report displayed in the current method, while Analysis Report Settings is for any analysis executed from this method.