Results
Overview
The Results tab computes and displays all the results for all the substances of the evaluation in all modes. As there can be several substances assigned to many sample vials in many tracks, a lot of information may be displayed:
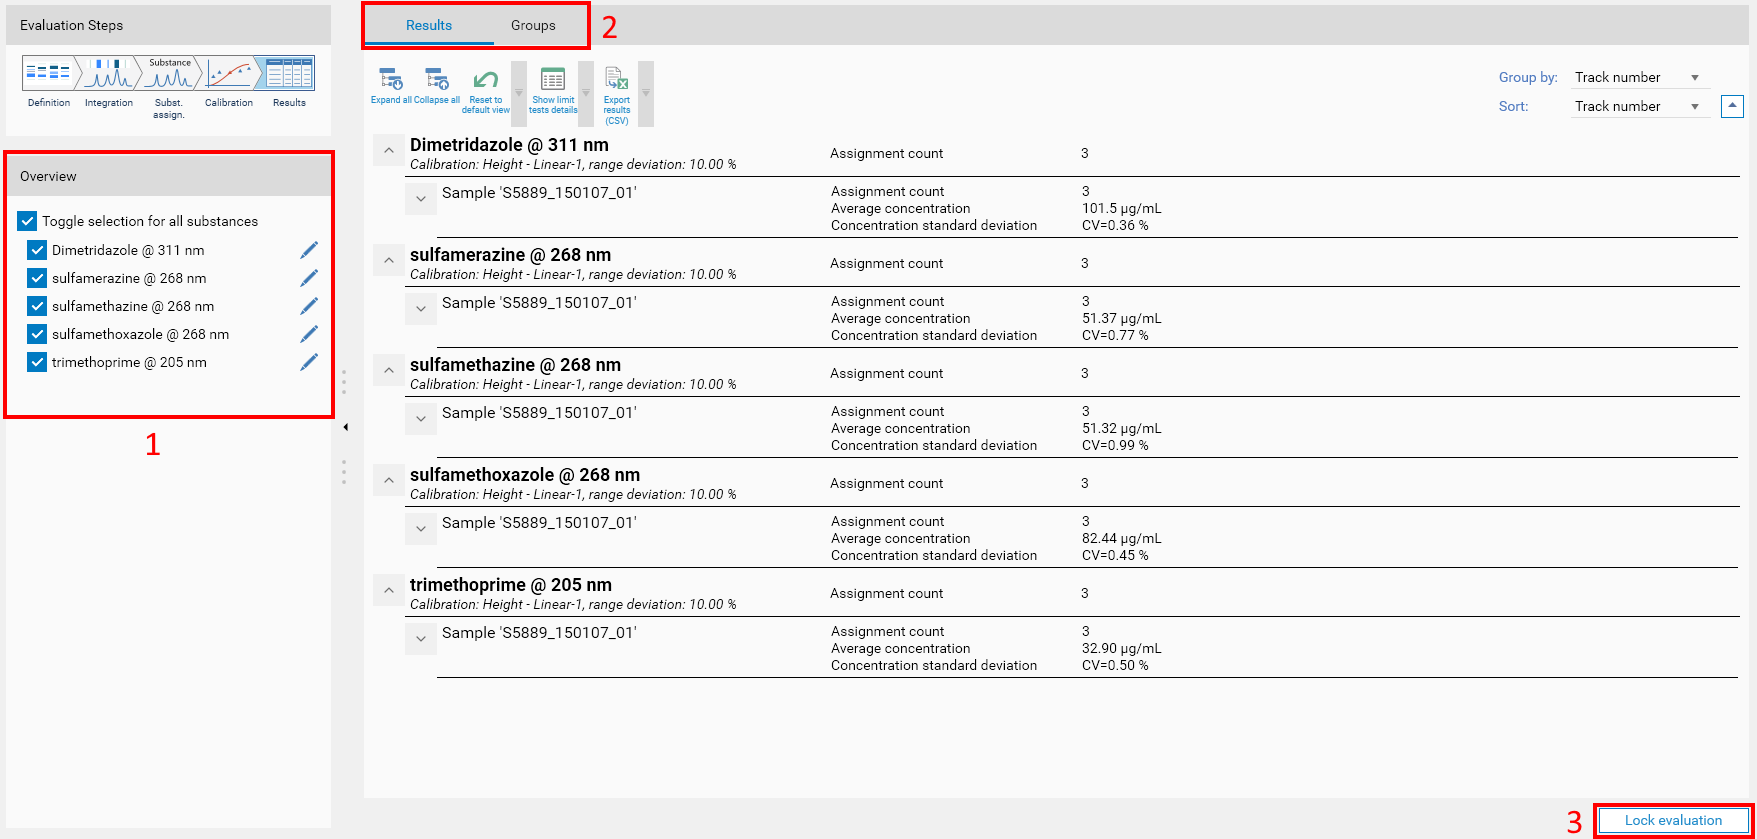
On the left side, the Overview (1) recalls the substances defined in the evaluation and allows to check/uncheck them in order to focus on some results.
Note
The substance defined as standard for error correction (if any) is not displayed at all in the Results tab. See Standard for error correction.
At the top of the tab, sub-tabs (2) are displayed:
Results: (default) the main sample results of the evaluation. See Main results.
Groups: allows to combine results for several substances. See Substances groups.
Related substances: displayed only if the Related substances advanced option is used in By dilution or By volume mode. See Related Substances.
Reproducibility: displayed only if the Reproducibility advanced option is used. See Reproducibility.
The Lock evaluation button (3) locks the current evaluation, preventing future modifications on this evaluation as well as any modification of a substance/reference vial defined. The deletion of a locked evaluation is possible though.
Main results
Main display
Toolbar
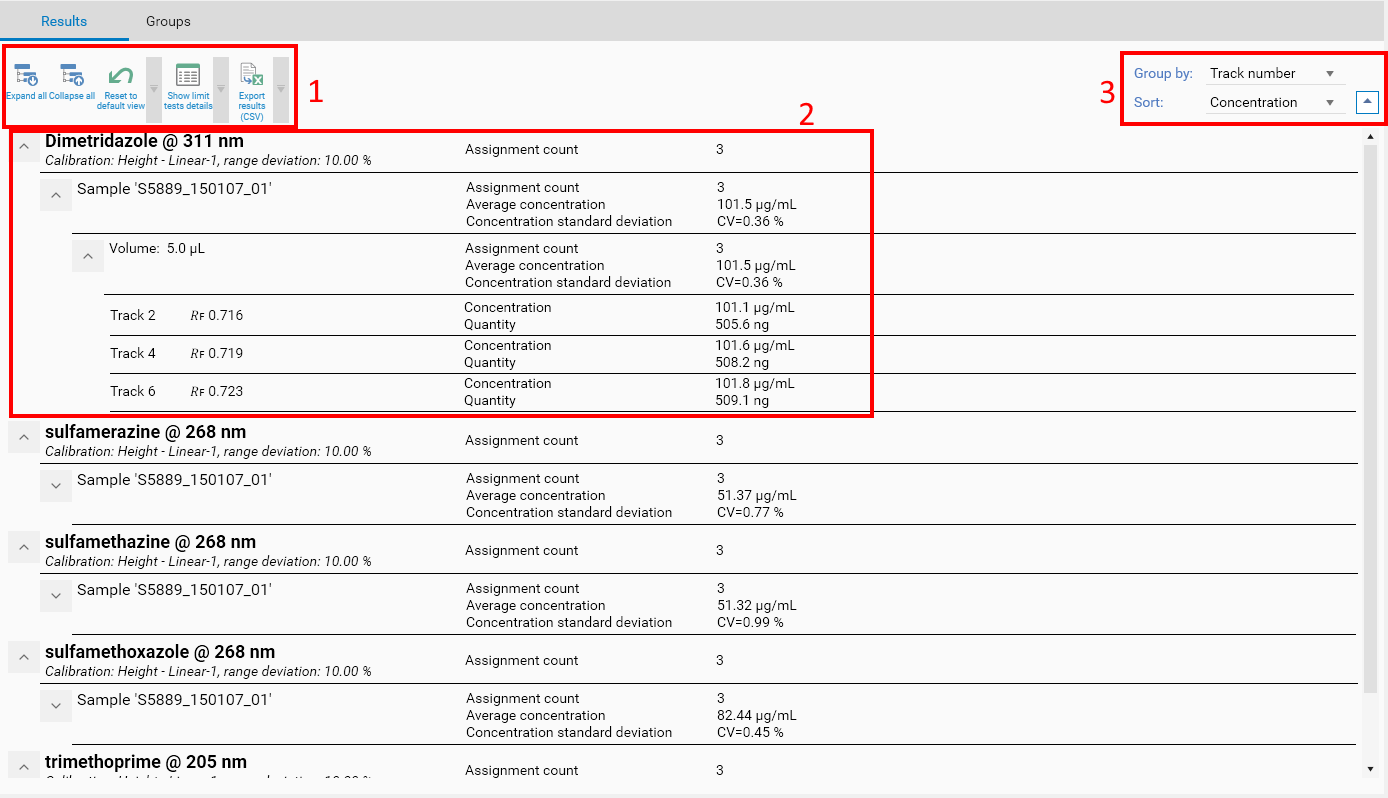
Use the Expand all, Collapse all and Reset to default view buttons to manipulate the tree.
Use the Show limit test details button to display the graphs associated with the limit test defined (see Limit tests).
Use the CSV export function to enable future processing of the results in another software. The exported file is a tabular export (flattened) of all data presented in the results tree.
Display of results
Results are always displayed in a tree with 4 levels:
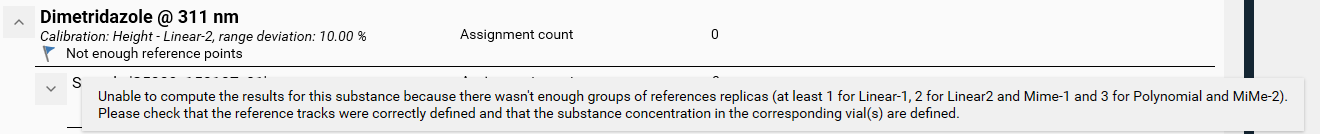
The top level displays the substance itself and recalls general information about its definition. Additionally, various flags can be displayed below the substance description to provide user feedback about potential problems related to the definition of the substance, the assignments, the calibration or the computation of the results. In the following example, there was only 1 calibration point (center of gravity of 3 reference replicates) but the Regression mode was set to Linear-2, which requires at least 2 calibration points. The corresponding flag is displayed with an explanatory tooltip:
Then, the second level displays an item for each sample or blank vial ID. In case of overspots, vial IDs are concatenated. For example, if a track is defined with sample vial S1 and an overspot with vial S2, the item will be named “S1,S2”, because the results are computed for the mixture of these 2 vials. Furthermore, visionCATS recalls the application type Sample or Blank (in case of overspots with Sample and Blank applications, the resulting type is named Vial). Additionally, if a sample reference amount was defined, it is displayed at this level (see Sample reference amount display).
Then, the third level displays an item for each applied volume. In case of overspots, the volume is the sum of the application volumes.
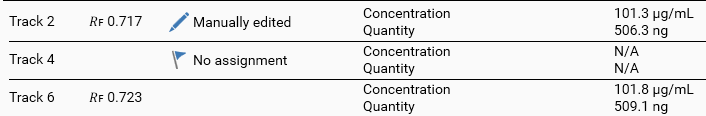
Finally, the fourth and last level display the results for each track. Apart from the track number and the 𝑅ꜰ, various flags and information can be displayed. In the following example, the peak assigned to the substance on track 2 was manually edited (its bounds were moved), while the assignment of track 4 was removed for the substance:
The default view expands the substance level and collapses the others in order to display a condensed view of the main results of the evaluation. At each level, the user can define items to display (see Configuring the display) and the associated limit tests (see Limit tests). For example, in the previous capture, the substance level was configured to display the Assignment count.
Sorting and grouping options
Results can be grouped by Track number (default, see previous capture) or by Property. For example, in the previous capture, it may be interesting to group the display by Property in order to make the comparison easier between tracks:
Additionally, inside each Substance/Vial/Volume group, track results can be ordered by Track number (default) or by Concentration.
Configuring the display
Concept
It is important to understand that all the information appearing at the right side of the results for a given substance is configurable:

Additionally, the configuration can be performed in the method, allowing method developers to configure the display to show only the necessary information. The last capture shows only the default display, which includes:
Substance level: the Assignment count
Vial level: Assignment count, the Average concentration and the Concentration standard deviation
Volume level: Assignment count, the Average concentration and the Concentration standard deviation
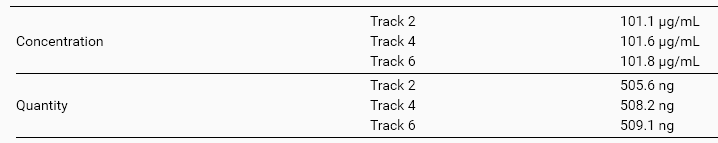
Track result level: Concentration and the Quantity
The configuration is always performed on a given tree level for a given substance. Consequently, the Concentration and the Quantity items, for example, are defined at the track level and not for each track separately, that’s why both values are automatically displayed for all tracks.
Performing the configuration
To configure the display, an edit button is available for each substance in the Overview part:
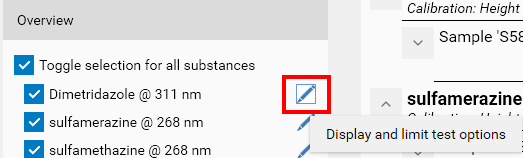
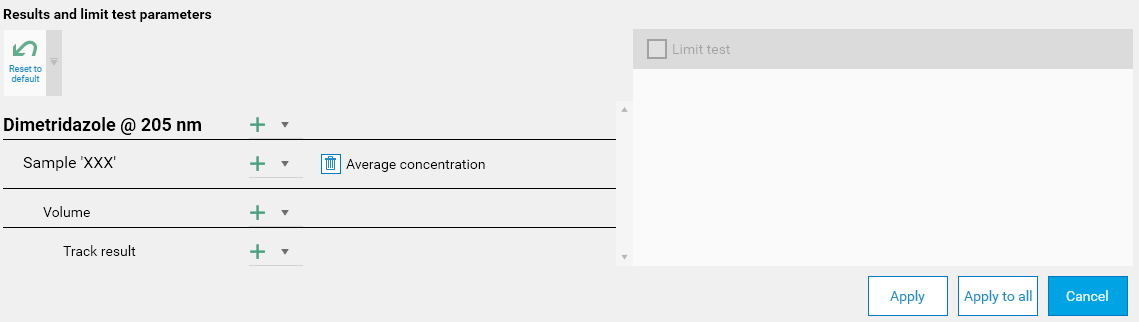
Hitting it opens the Results and limit test parameters popup. On the left side, the display recalls the 4 tree levels (substance, sample vial, volume and track result) and provides the necessary functions to perform the configuration:
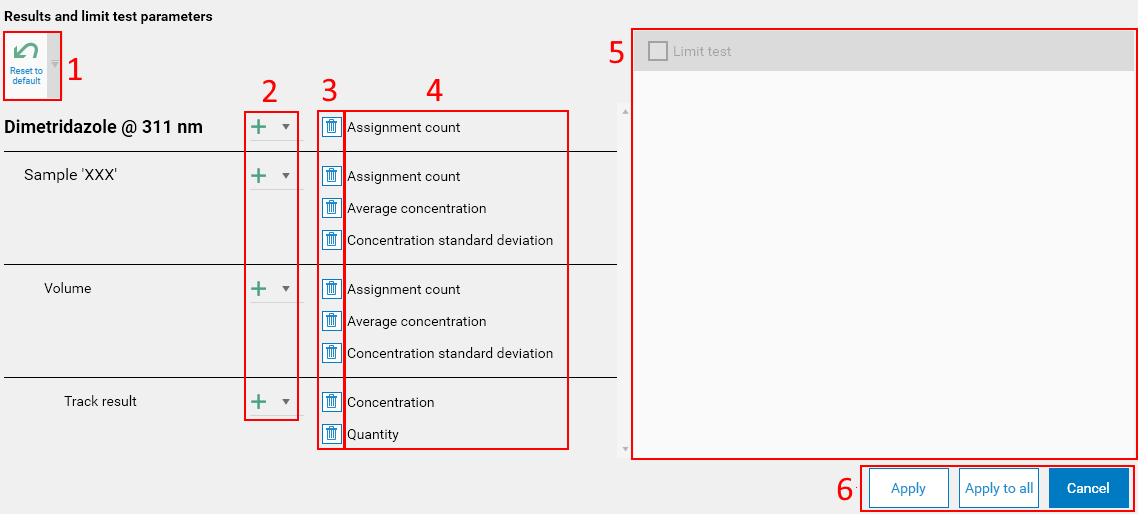
The Reset to default button resets the display items (4) to the default display previously detailed in this section.
At each tree level, a button allows to add an item to display. At the substance, sample vial and volume levels, the following items are available:
Assignment count: the number of Sample / Blank tracks having a quantitative result, that is, having a successfully computed Concentration / Quantity from an assignment to this substance. For example, if the method requires each sample to be applied 3 times (triplicates), displaying the Assignment count at the sample vial level allows to see whether the 3 results were correctly computed for each applied sample.
Min. / Max. / Average / Standard deviation of Concentration / Quantity : computed on Sample / Blank tracks having a quantitative result. These items can be used in various situations. While the Average concentration / Concentration standard deviation combination is probably the most useful, min./max. values can be interesting to check a range of values. Use Quantity counterparts if they make more sense in the context of the method.
At the track result level, the following items are available for substances in Single and Range assignment modes (see Assignment mode):
Concentration / Quantity: the main quantitative result.
Peak height / Peak area / Peak resolution: values of the corresponding peak. These values are available as soon as an assignment was performed, i.e. they do not require any calibration. Consequently, they can be used when studying various quality-related indicators (peak separation, evaluation of signal-to-noise ratio by analyzing blank ranges, alternative to Reproducibility by comparing peak values).
In Multiple assignment mode (see Assignment mode), the Concentration / Quantity values are also available (based on the sum of the corresponding peaks), but other peak-related items are available : Sum, Min., Max., Average of peaks height / area. Use these items when analyzing unknown substances, unknown components or impurities of a given substance. For example, if it is known that a set of unknown impurities result in a set of peaks in a given 𝑅ꜰ range, defining a substance in Multiple assignment mode on this range and then comparing peaks with the main substance allows to determine the impurity level. By using Related Substances together with a limit test (see Limit tests), the impurities can even be quantified. Furthermore, note that LOD / LOQ is sometimes determined by analyzing a set of small peaks, based on Min., Max., Average peak values.
Hit the Delete button to remove the display of an item.
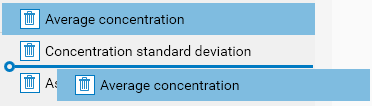
The lists of items to display at each level is displayed here. Note that the order in the list defines the display order. Additionally, it is possible to reorder items by dragging/dropping them:
Part used to configure limit tests (see Limit tests).
The Apply button validates the changes for the current substance, while the Apply to all button sets the display items for all substances in the current evaluation.
Usage
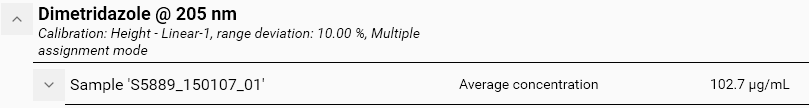
While the default display items corresponds to interesting values in most situations, the different display items available allows the method developer to evaluate the quality and the robustness of the method during its development. Then, once the method is defined, it can definitely make sense, for example, for a method developer to hide everything except the resulting concentration for samples if this is the only output expected for the evaluation. Then, the Results and limit test parameters popup will be configured this way:
The main results display will then be very simple:
Limit tests
Concept
It is possible to define a limit test for each displayed item (see Configuring the display). In the main results display, each displayed item has a value. When a limit test is defined, there is a reference value which is compared to the value of the displayed item. The comparison always results in one of the following state:
 : Limit test passed.
 : Limit test failed.
 : Limit test was not computed. Possible reasons:
The value on which the limit test must be performed is not available. Review the assignments and the calibration for the substance.
The limit test parameters were not correctly filled. Review the limit test parameters.
Together with the different displayed items, defining limit tests allows to check results data in many ways corresponding to usual scenarios. Here are some possibilities:
Check that the concentrations of the samples correspond to the reference concentration with 2 % allowed deviation.
Check that each sample was applied 2 times.
Check that the peak resolution is large enough.
Check that impurities do not exceed 2 % of the main substance.
Check that the blank solvent did not contain any peak above the LOD.
Note
The different options available when defining limit tests are presented in the next sections.
Display of limit tests
In the main results display, limit tests are displayed with additional columns:
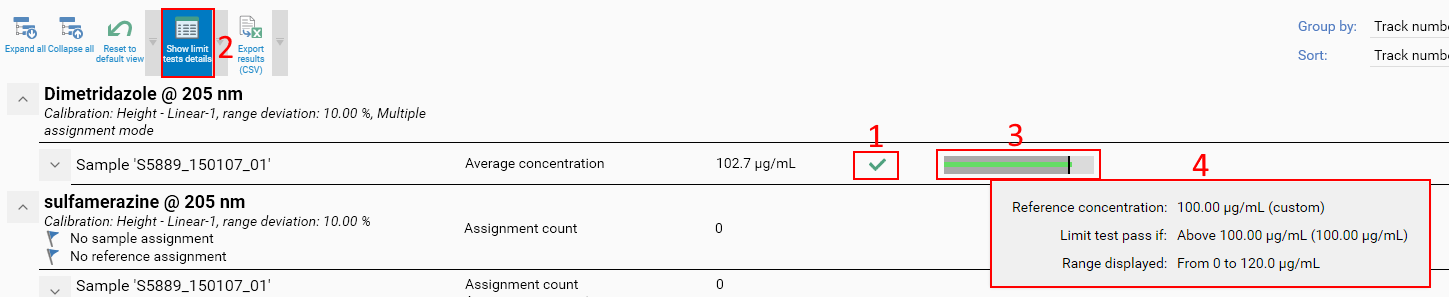
By default, only the status (1) is displayed, when a limit test is defined on an item to display. In the last capture, a limit test was defined on the Average concentration display item at the sample vial tree level. By clicking on the Show limit test details button (2), an additional column (3) appears with a graph which provides a visual explanation of the limit test status. The graph displays information as follows:
The background consists in Light gray and Gray rectangles showing respectively the zones where the limit test passes and does not pass.
On top of it, a Green or Red rectangle represents the sample value.
Finally, a black vertical line recalls the limit test reference value.
Note
The graph do not appear if the limit test status is unknown ().
To avoid the display of too much information, the graph itself does not show any axis with numerical values, but the tooltip (4) recalls all the values used to compute the graph:
The reference value and how it was computed.
The limit test condition.
Information about the range displayed by the graph. The range generally goes from 0 to the limit test reference value +20 % (or to the maximum value + 1 in case of a limit test defined on Assignment count). This way, at the track result tree level, the results for a given displayed item limit test share the same range which makes them easy to compare visually.
In the last capture, the value (102.7 μg/mL) appeared as a Green rectangle because it was greater than the reference value (100.00 μg/mL). Indeed, in the graph, the Green rectangle slightly exceeds the Gray rectangle and the black vertical line. If the limit test is set to pass if below instead of above, the following graph appears:
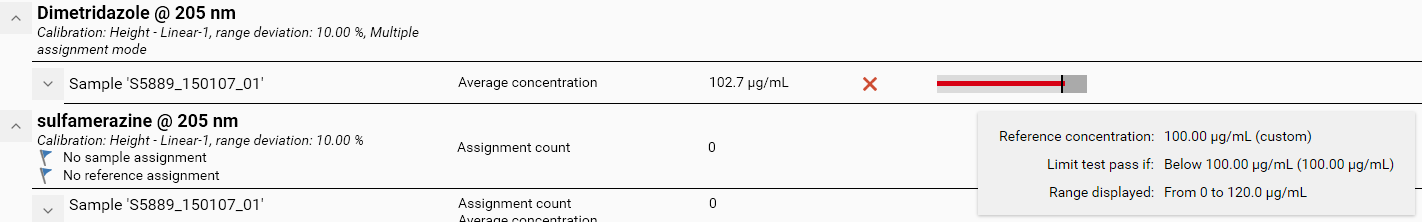
Note
Values above the limit test reference value +20% (or to the maximum value + 1 in case of a limit test defined on Assignment count) are cropped.
Configuring limit tests
To configure limit tests, edit the corresponding substance by opening the Results and limit test parameters popup (see Performing the configuration). Then, select the display item (1) on which the limit test should be configured and check the Limit test box (2):
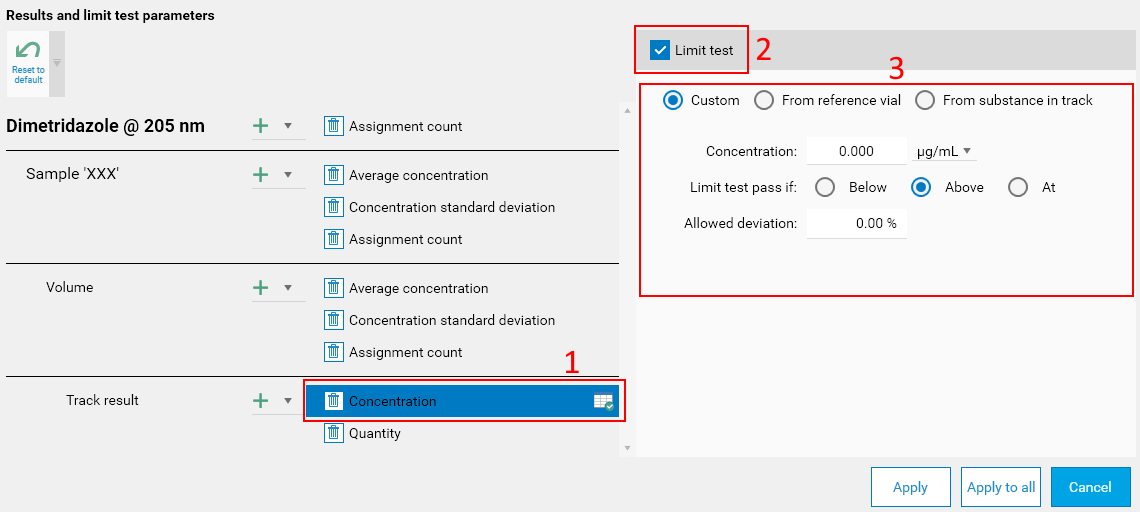
This makes the configuration options appear (3). The configuration options available depend on the type of the display item:
Type Concentration (also concerns min., max., average concentrations)
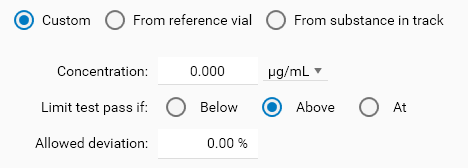
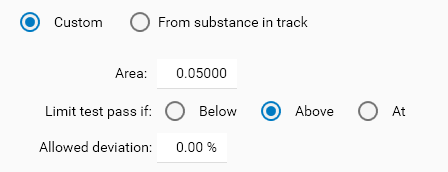
Custom mode
This mode allows to define a specific limit concentration manually. Use it do define fixed and absolute limit determined once during the method development or provided by some documentation.
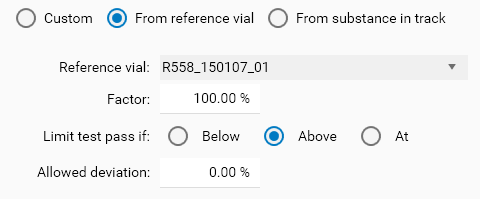
From reference vial mode
This mode allows to select a Reference vial, whose concentration will be the limit test reference value. It is possible to configure a Factor to apply to the Reference vial concentration, in order to handle situations where the sample concentration should reach at least X % of the reference vial concentration.
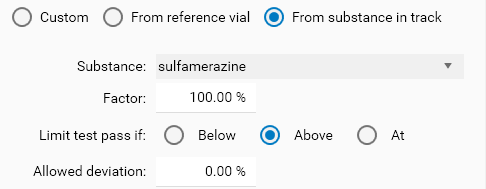
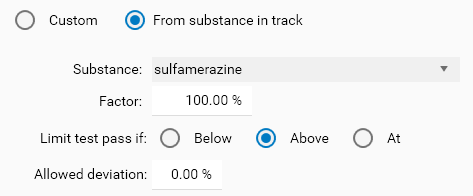
From substance in track mode (available only at track result tree level)
With this mode, the limit concentration is, for each sample track, provided by the concentration of another substance in the track. It allows to handle situations where the sample concentration of Substance A should not exceed X % of the sample concentration of Substance B.
In each mode, Limit test pass if allows to choose between the Below (less or equal than), Above (greater or equal than) or At (equal) options, with an Allowed deviation. For example, a reference concentration of 100.00 μg/mL in Below mode with Allowed deviation set to 2 % results in a limit test passing when the sample concentration is less or equal than 102.00 μg/mL. In At mode, a sample concentration between 98.00 μg/mL and 102.00 μg/mL will pass. In Above mode, a sample concentration greater or equal than 98.00 μg/mL will pass.
Note
From reference vial without Reference vial, or From substance in track without Reference substance will result in unknown limit test states ().
Type Quantity (also concerns min., max., average quantities)
Same as for concentration values, except that the From reference track mode replaces the From reference vial mode, where Reference track must be selected instead of the Reference vial.
Type Assignment count
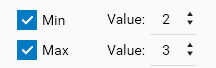
The limit test configuration allows to define the Min and/or Max number. Possible use cases:
If each sample must be applied 3 times (triplicate), there can be a limit test specifying that exactly 3 sample assignments must have been found at the sample vial level.
If it can be assumed that the substance is present in all samples of the analysis, then a limit test can be defined to check that the X corresponding samples assignment were found.
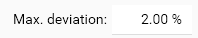
Type Standard deviation (for quantities and concentrations)
For each concentration/quantity standard deviation, a limit test can specify the Max. deviation, which can be used for example to check that the sample replicates do not differ too much.
Type Peak value (concerns peak height, area and specific height/area display items available for substance in Multiple assignment mode (see Assignment mode))
This type has similar Custom and From substance in track modes as the Concentration and Quantity types. It can be useful in all situations where the quantification result is not/cannot be computed, for example when Blank (or even Background) tracks are evaluated, or when a set of impurities are evaluated without being quantified (by comparing peak heights/areas).
Note
Peak height values are defined with 4 decimal digits whereas area values are defined with 5 decimal digits.
Type Peak resolution
The peak Min. resolution can be defined, to act like a peak quality check. Note that the resolution considered is the minimal resolution between Res. (n-1) and Res. (n+1) (N/A excluded) (see Peaks).
Sample reference amount display
At the vial tree level, when a sample reference amount was defined (see Samples), it appears below the vial name:
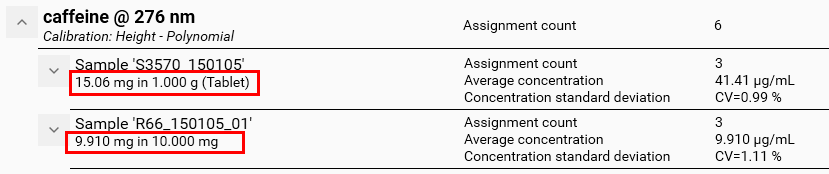
Vial S3570_150105 : the result concentration 41.41 μg/mL was obtained by diluting 1.375 g in 500 mL. Consequently, there was 20.71 mg of caffeine in 1.375 g. The original tablet of 1 g contained 15.06 mg of caffeine.
Vial R66_150105_01 : the result concentration 9.91 μg/mL was obtained by diluting 10 mg in 1 L. Consequently, there was 9.91 mg of caffeine in 10 mg.
Substances groups
Overview
Substances groups can be defined to combine results from several known substances. This differs from the case of unknown substances, which can be evaluated together in an encompassing substance by using the Multiple assignment mode (see Assignment mode).
Substances groups are actually a post-processing tool built on top of the regular computation of the results (see Main results). Each group combines a set of substances defined in the current evaluation (see Substance Table) to show the result of Operations (Sum, Min, Max, and/or Average) performed on Properties (Concentration, Quantity, Peak height and/or Peak area).
Each Operation / Property computation is always performed individually for each Sample / Blank track and can optionally be associated with a limit test. Limit tests for substance groups behave the same way as regular limit tests (see Limit tests).
The definition of substances groups can be performed in methods and in analysis files, allowing method developers to specify the Operations, Properties and limit tests to focus on. It is possible to define as many substances groups as necessary, and several groups can be defined for the same group of substances.
Definition
Initially, the Groups tab is empty:
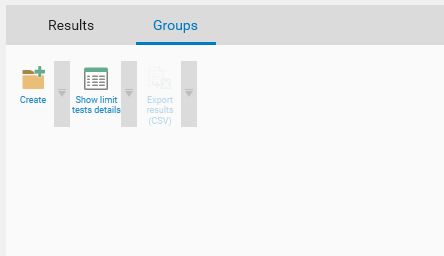
By hitting the Create button, the Group parameters popup is displayed:
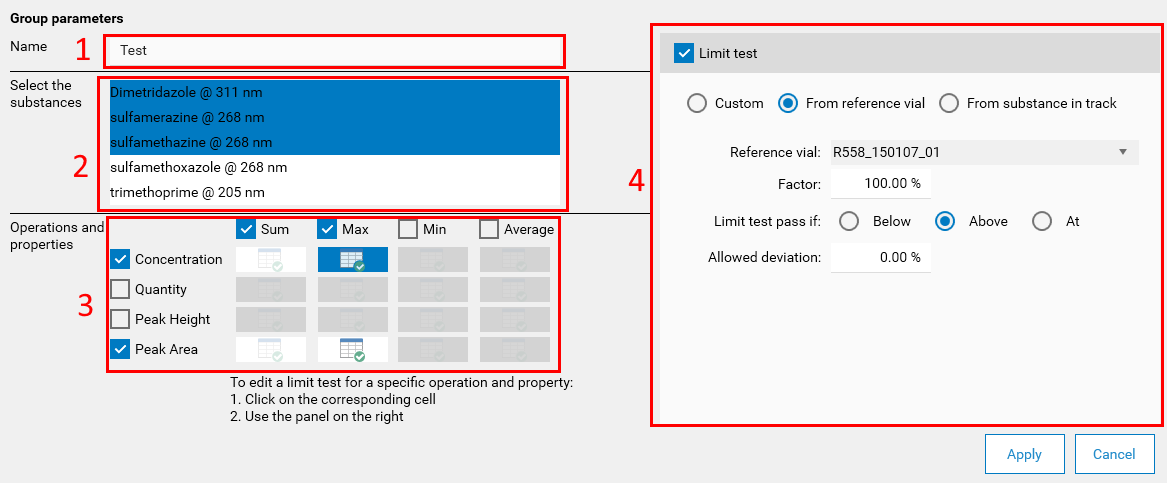
Define the name of the group if necessary. By default, visionCATS names it “Group X”, with X starting at 1.
Choose the substances of the group by clicking on them. At least one substance must be selected.
Note
Substances in Reproducibility mode can’t be used.
Choose at least one Operation and one Property. In the previous capture, the selection of the Min / Max operations to perform on the Concentration / Peak area properties will lead to the computation of 4 values for each track result. When a Operation /Property combination is chosen, the corresponding cell in the table is activated. Clicking on it allows to activate the corresponding limit test. In the previous capture, a limit test on Max /Peak Area was already defined and the limit test for Max /Concentration is being currently edited.
Configure the limit test of the currently selected Operation / Property cell. Refer to Limit tests for more information about the available parameters.
Display
With the parameters of the previous capture, visionCATS displays the group results in the following way:
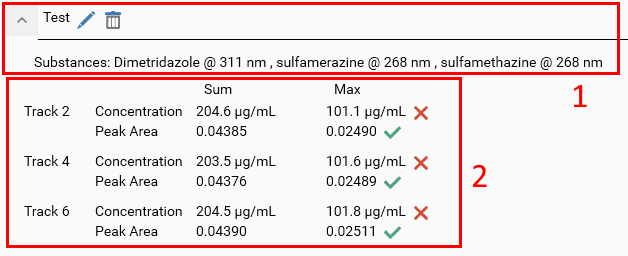
The group itself can be expanded/collapsed, which can be useful when multiple groups are defined. The header recalls the group name and the selected substances. Additionally, the usual Edit (which opens the Group parameters popup again, see Definition) and Delete buttons are available.
The substance group results are displayed in a table where the Operation / Property combination table is displayed for each track result. In the previous capture, the 4 values were indeed computed and displayed for the 3 sample tracks. The operations and properties which were not selected don’t appear at all. Additionally, the limit test statuses are displayed immediately next to the corresponding result if they were configured.
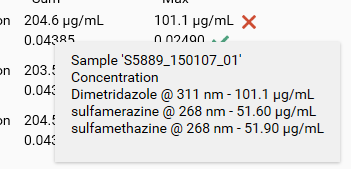
In order to understand the data being displayed, visionCATS provides tooltips. In the next capture, the concentration is indeed the sum of the concentrations of the 3 substances:
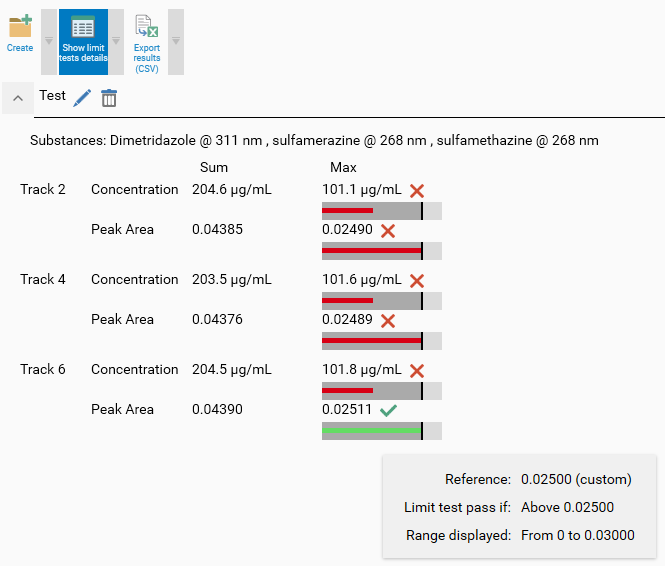
Finally, the Groups tab provides similar functions as in the Results tab:
The Show limit test details button displays the limit test graphs (see Limit tests) and provides the usual tooltips under each result associated with a limit test:
Hit the Export results (CSV) button to get a tabular export of the substances groups data for further processing.