Bullet graph for limit tests
In the client, it is possible to display a bullet graph for each limit test, but the standard report template only shows the status. Here we will add a similar bullet graph in the report.
If you don’t have an user template yet, please first duplicate an existing template (see Report templates).
Then download it to an empty folder. You will get a file structure like in Report temporary files structure (expect that neither PDF file nor index.html will be present).
The Partials folder contains the template structure. The entry point is the file
report.html, which redirect to the other partials.Edit the
EvaluationevaluationResultsDisplayValue.htmlfile.We will add a new table row, by adding the following code before
{{/each}} <!--DisplayItemValues-->{{#if HasLimitTest}} {{#if (ne ComputedLimitTestStatus 2)}} <tr> <td></td> <td colspan="3"> <div class="evaluationResultsLimitChart bulletchart" id="{{ID}}"></div> </td> </tr> {{/if}} {{/if}}In
Scriptsfolder, create a new filebullet.js.Put the following code in it:
    'use strict';

    (function()
    {
    // Chart design based on the recommendations of Stephen Few. Implementation
    // based on the work of Clint Ivy, Jamie Love, and Jason Davies.
    // http://projects.instantcognition.com/protovis/bulletchart/
            d3.bullet = function()
            {
                    var orient = 'left',
                            reverse = false,
                            ranges = bulletRanges,
                            markers = bulletMarkers,
                            measures = bulletMeasures,
                            width = 380,
                            height = 30;

                    // For each small multiple…
                    function bullet(g)
                    {
                            g.each(function(d, i)
                            {
                                    var rangez = ranges.call(this, d, i).slice().sort(d3.descending),
                                            markerz = markers.call(this, d, i).slice().sort(d3.descending),
                                            measurez = measures.call(this, d, i).slice().sort(d3.descending),
                                            g = d3.select(this);

                                    var marker = markerz.length > 0 ? markerz[0].value : 0;

                                    // Compute the new x-scale.
                                    var x1 = d3.scaleLinear()
                                            .domain([0, Math.max(rangez[0], marker, measurez[0].value)])
                                            .range(reverse ? [width, 0] : [0, width]);


                                    var markerx1 = (d) => { return x1(d.value); };

                                    var markerColor = (d) => { return d.color; };
                                    // Stash the new scale.
                                    this.__chart__ = x1;

                                    // Derive width-scales from the x-scales.
                                    var w1 = bulletWidth(x1);

                                    // Update the range rects.
                                    var range = g.selectAll('rect.range')
                                            .data(rangez);

                                    range.enter().append('rect')
                                            .attr('class', (d, i) => 'range s' + i)
                                            .attr('height', height)
                                            .attr('width', w1)
                                            .attr('x', reverse ? x1 : 0);


                                    // Update the measure rects.
                                    var measure = g.selectAll('rect.measure')
                                            .data(measurez);

                                    measure.enter().append('rect')
                                            .attr('class', (d, i) => 'measure s' + i)
                                            .attr('height', height / 3)
                                            .attr('y', height / 3)
                                            .style('fill', d => markerColor(d, i))
                                            .attr('width', d => w1(d.value))
                                            .attr('x', reverse ? x1 : 0);


                                    // Update the marker lines.
                                    marker = g.selectAll('line.marker')
                                            .data(markerz);

                                    marker.enter().append('line')
                                            .attr('class', 'marker')
                                            .attr('y1', 0)
                                            .attr('y2', height)
                                            .style('stroke', d => markerColor(d, i))
                                            .attr('x1', (d, i) => markerx1(d, i))
                                            .attr('x2', (d, i) => markerx1(d, i));
                            });
                    }

                    // left, right, top, bottom
                    bullet.orient = function(x)
                    {
                            if (!arguments.length)
                                    return orient;
                            orient = x;
                            reverse = orient === 'right' || orient === 'bottom';
                            return bullet;
                    };

                    // ranges (bad, satisfactory, good)
                    bullet.ranges = function(x)
                    {
                            if (!arguments.length)
                                    return ranges;
                            ranges = x;
                            return bullet;
                    };

                    // markers (previous, goal)
                    bullet.markers = function(x)
                    {
                            if (!arguments.length)
                                    return markers;
                            markers = x;
                            return bullet;
                    };


                    // measures (actual, forecast)
                    bullet.measures = function(x)
                    {
                            if (!arguments.length)
                                    return measures;
                            measures = x;
                            return bullet;
                    };

                    bullet.width = function(x)
                    {
                            if (!arguments.length)
                                    return width;
                            width = x;
                            return bullet;
                    };

                    bullet.height = function(x)
                    {
                            if (!arguments.length)
                                    return height;
                            height = x;
                            return bullet;
                    };


                    return bullet;
            };

            function bulletRanges(d) { return d.ranges; }

            function bulletMarkers(d) { return d.markers; }

            function bulletMeasures(d) { return d.measures; }

            function bulletWidth(x)
            {
                    var x0 = x(0);
                    return function(d) { return Math.abs(x(d) - x0); };
            }
    })();

It will allow the rendering of bullet graphs.
In
Scriptsmain.js, we can now add the graph function. Please add the following code below the other graphs functions (just before the closing};):$('.evaluationResultsLimitChart').each(function() { var chartDataId = $(this).attr('id'); var displayItemValue; context.EvaluationData.forEach(function(evaluation) { if (evaluation.Results) { evaluation.Results.forEach(function(result) { if (result.DisplayItemValues.some(function(item) { if (item.ID === chartDataId) { displayItemValue = item; return true; } return false; })) return true; if (result.SampleVialResults.some(function(svr) { if (svr.DisplayItemValues.some(function(item) { if (item.ID === chartDataId) { displayItemValue = item; return true; } return false; })) return true; if (svr.VolumeResults.some(function(vr) { if (vr.DisplayItemValues.some(function(item) { if (item.ID === chartDataId) { displayItemValue = item; return true; } return false; })) return true; if (vr.TrackResultItems.some(function(tri) { if (tri.DisplayItemValues.some(function(item) { if (item.ID === chartDataId) { displayItemValue = item; return true; } return false; })) return true; return false; })) return true; return false; })) return true; return false; })) return true; return false; }); } }); var ltParams; var d1 = {}; var markerValue; switch (displayItemValue.LimitTestModeStr) { case 'Quantity': ltParams = displayItemValue.LimitTestQuantityParameters; d1.ranges = [ltParams.LowerAroundLimitInGraph, ltParams.UpperAroundLimitInGraph, ltParams.MaximumInGraph]; markerValue = ltParams.ReferenceQuantity; break; case 'Concentration': ltParams = displayItemValue.LimitTestConcentrationParameters; d1.ranges = [ltParams.LowerAroundLimitInGraph, ltParams.UpperAroundLimitInGraph, ltParams.MaximumInGraph]; markerValue = ltParams.ReferenceConcentration; break; case 'Count': ltParams = displayItemValue.LimitTestCountParameters; d1.ranges = [ltParams.LowerAroundLimitInGraph, ltParams.UpperAroundLimitInGraph, ltParams.MaximumInGraph]; markerValue = ltParams.LimitInGraph; break; case 'Deviation': ltParams = displayItemValue.LimitTestDeviationParameters; d1.ranges = [ltParams.MaxDeviation, ltParams.MaximumInGraph]; markerValue = ltParams.MaxDeviation; break; case 'Peak': ltParams = displayItemValue.LimitTestPeakParameters; d1.ranges = [ltParams.LowerAroundLimitInGraph, ltParams.UpperAroundLimitInGraph, ltParams.MaximumInGraph]; markerValue = ltParams.ReferenceValue; break; case 'PeakResolution': ltParams = displayItemValue.LimitTestPeakResolutionParameters; d1.ranges = [ltParams.MinResolution, ltParams.MaximumInGraph, ltParams.MaximumInGraph]; markerValue = ltParams.MinResolution; break; } //don't display a graph for uncomputed values if (ltParams == null || displayItemValue.ComputedLimitTestStatus === 2) return; //d1.ranges = [ltParams.LowerAroundLimitInGraph, ltParams.UpperAroundLimitInGraph, ltParams.MaximumInGraph]; d1.measures = [ { "value": displayItemValue.Value, "color": displayItemValue.ComputedLimitTestStatus === 0 ? '#64DC64' : '#D70014' } ]; if (markerValue != null) d1.markers = [{ "value": markerValue, "name": 'limit', "color": 'black' }]; else d1.markers = []; const data = [d1]; const chartSel = d3.select($(this)[0]); const chartDiv = chartSel.node(); // set the dimensions and margins of the graph var margin = { top: 5, right: 10, bottom: 5, left: 10 }, width = chartDiv.clientWidth - margin.left - margin.right, height = chartDiv.clientHeight - margin.top - margin.bottom; var chart = d3.bullet() .width(width) .height(height); // append the svg object to the body of the page chartSel.selectAll('.bullet').data(data) .enter().append('svg') .attr('class', 'bullet') .attr('width', width + margin.left + margin.right) .attr('height', height + margin.top + margin.bottom) .append('g') .attr('transform', 'translate(' + margin.left + ',' + margin.top + ')') .call(chart); });
Some CSS rules are needed for the graph. Open
Stylesmain.cssand add at the end:.bulletchart { height: 28px; margin: 0 0 0 0; page-break-inside: avoid !important; /*prevent page break inside chart*/ width: 100%; } .bullet { font: 10px sans-serif; } .bullet .marker { stroke: #000; stroke-width: 2px; } .bullet .range.s0 { fill: #AAAAAA; } .bullet .range.s1 { fill: #DBDBDB; } .bullet .range.s2 { fill: #AAAAAA; }
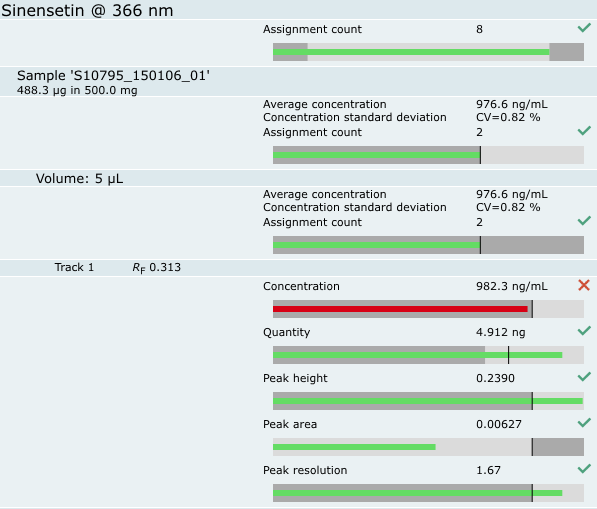
Upload the template in visionCATS and try it.
Et voilà, we should now have a report like that:
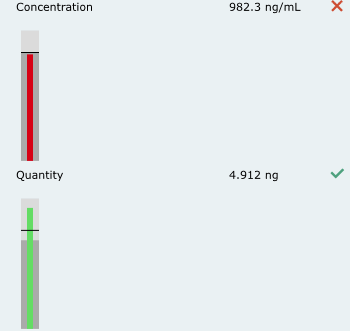
Vertical bullet graph
Do all the above steps up to the 7 (included)
The height of the graph will be related to the height of the class bullet chart, we need to change it:
.bulletchart {
    height: 150px;
    margin: 0 0 0 0;
    page-break-inside: avoid !important;
    /*prevent page break inside chart*/
    width: 100%;
}
In
Scriptsmain.js, we need to change the “height” of the graph, which will become the width, and add a rotation transformation. Change the following block of code at the end of the added function:var margin = { top: 5, right: 10, bottom: 5, left: 10 }, width = chartDiv.clientHeight - margin.left - margin.right, height = 28 - margin.top - margin.bottom; var chart = d3.bullet() .width(width) .height(height); // append the svg object to the body of the page chartSel.selectAll('.bullet').data(data) .enter().append('svg') .attr('class', 'bullet') .attr('height', width + margin.left + margin.right) .attr('width', height + margin.top + margin.bottom) .append('g') .attr('transform', 'translate(' + margin.top + ',' + (chartDiv.clientHeight - margin.bottom) + ') rotate(270)') .call(chart);
Upload the template in visionCATS and try it.
Et voilà, we should now have a report like that: