System Suitability Testing (SST)
Important
SST tracks are defined in the Track Assignment, column SST.
Note
When one or more SST are defined, popup will remind the user to check the SST before working on evaluation, or exporting to comparison.
In this tab, you can define and validate SST.
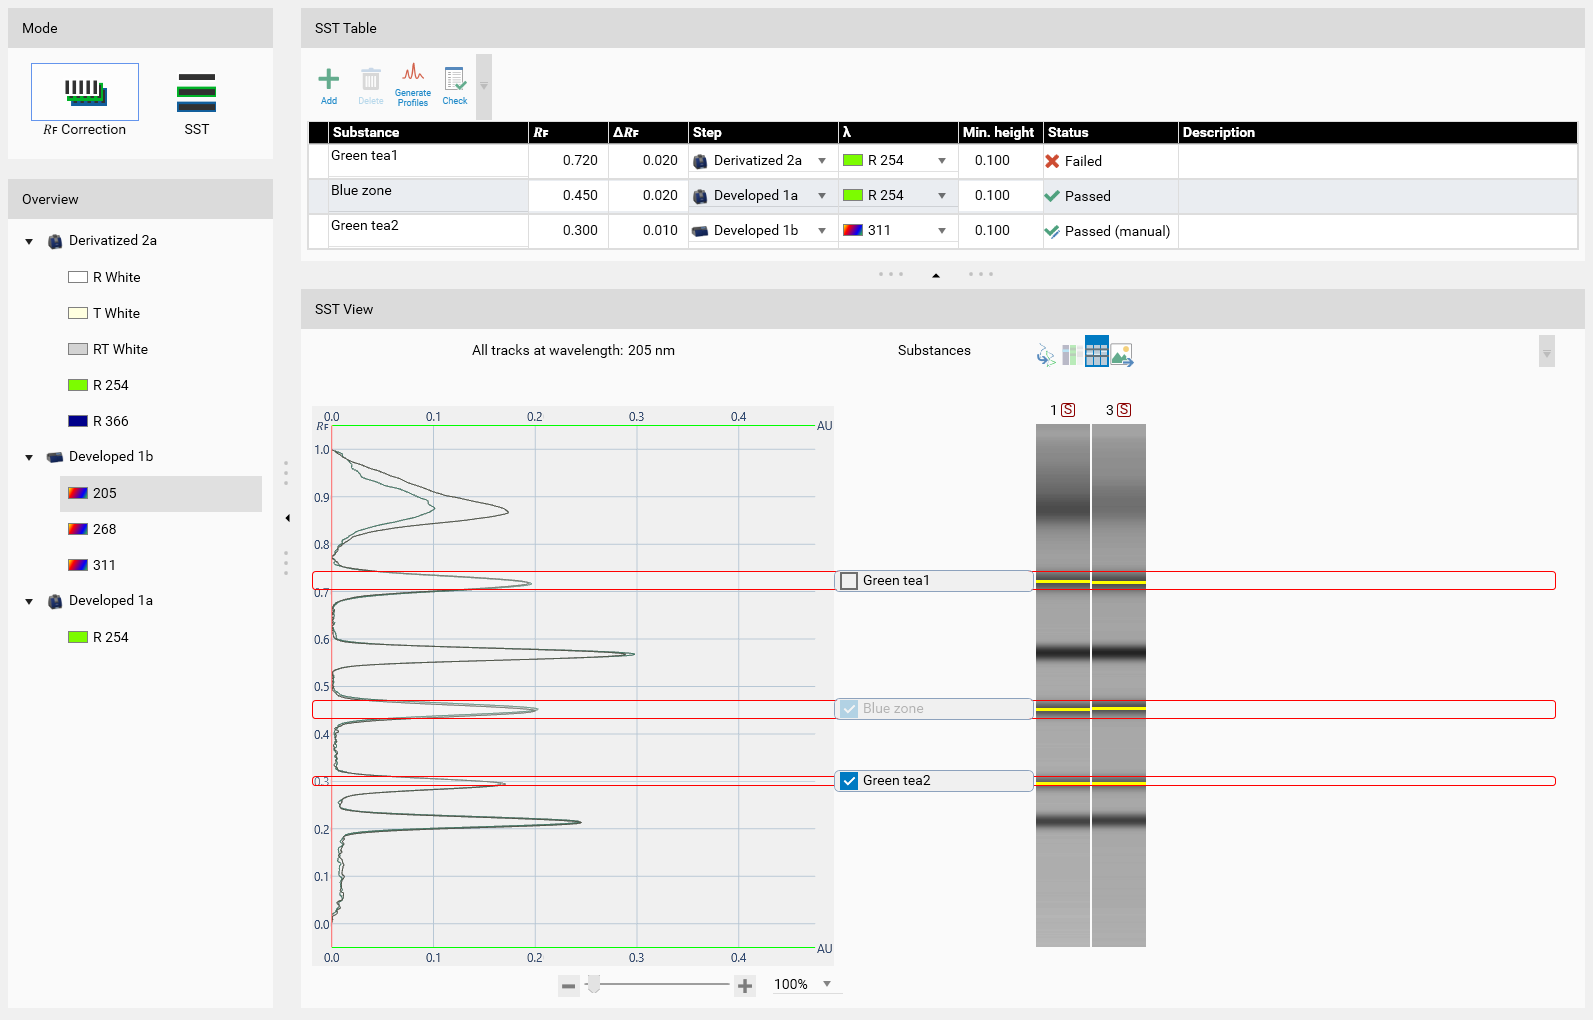
SST Table
It is the definition of the tests, e.g. which substance should be at which 𝑅ꜰ. Each SST definition has the following fields:
Substance: the substance name of the SST spot
𝑅ꜰ: the nominal 𝑅ꜰ value of this SST
Δ𝑅ꜰ: the authorized variation around the nominal 𝑅ꜰ
Step: the step which should be used for checking
λ: wavelength or illumination which should be used for checking (only the ones available from the select step are visible)
Min. height: the minimum height of the peak detected at the 𝑅ꜰ/Δ𝑅ꜰ range with default integration parameters (corresponding to the default evaluation integration parameters when creating a new evaluation). You can let this field empty to indicate that the SST doesn’t check the peak height at all.
Status: the state of SST definition:
 Failed
 Passed
 Manually marked as passed
 Not computed: click on the Check button (all the steps used in the SST definition should already be done)
Description
 Add an SST substance
 Delete the currently selected SST substance definition
 Generate profiles for all track (from image data)
Note
Deletes all output data (peaks, assignments, calibration functions and results) for evaluations based on a TLC Visualizer step
Only available if the current analysis does not contain any locked evaluation based on a TLC Visualizer step
 Check SST for all substances
Note
Check SST will automatically verify that each SST definition match a peak on each SST track.
Overview
Here you can select the illumination or wavelength of a specific HPTLC step you want to view. Clean plate data acquisition steps are not shown. For TLC Visualizer steps, the profiles must be generated by using the Generate Profiles function in the Data tab of the analysis.
Note
The selected illumination or wavelength in overview will not influence the automatic check.
Note
This section is not available for visionCATS Methods.
SST View
In this section, the profile (on the left side) and the pseudo track (right side) is displayed for each track defined as SST, at the selected illumination/wavelength. In the middle, each substance is positioned relatively to its 𝑅ꜰ and 𝑅ꜰ window defined in the SST Table. You can check a substance to define it as Passed.
The main display has the following options:
It’s possible to display only one profile on the left side by selecting the corresponding pseudo track on the right side. In the toolbar, click on the first button to reset the selection.
In case of TLC Visualizer profiles and tracks, the list of tracks can be displayed in gray scale or in RGB mode.
In order to better localize the position of the peaks, the toolbar includes a function to display the local maximum on each track in each substance window.
The zoom tool will allow to enhance the displayed separation (𝑅ꜰ axis). The peak forms are then also more visible.
For each SST definition, a substance banner will be displayed:

Important
It is possible to manually mark as passed a SST definition via the check box on the banner.
Note
This section is not available for visionCATS Methods.