LOD / LOQ
Overview
visionCATS provides the support of the widely-used concept of Limit Of Detection (LOD) and Limit Of Quantification (LOQ) by defining:
The LOD as the minimal detectable value. Values falling below the LOD are not displayed at all, as by definition it is not possible to distinguish them from 0. Consequently:
If a Reference calibration point value falls below the LOD, then the whole calibration fails. No regression function is displayed and no sample result can be computed. It is still possible, as a workaround, to manually exclude the corresponding track(s) or remove the corresponding assignment(s).
If a Sample (or Blank) calibration point value falls below the LOD, then no quantitative result is computed for it.
The LOQ as the minimal quantifiable value (i.e. satisfies acceptable accuracy and repeatability). Values falling below the LOQ are computed and displayed but the quantification is considered not reliable enough:
If a Reference calibration point value falls below the LOQ, then the calibration is performed and sample results are computed, but the whole calibration is displayed with a corresponding warning.
If a Sample (or Blank) calibration point value falls below the LOQ, then the result is computed and displayed with a corresponding warning.
Limit Of Detection (LOD) and Limit Of Quantification (LOQ) values can be determined and defined on each substance defined in an evaluation. Both values are quantities in visionCATS, because the Calibration is always based on reference quantities. They are expressed in the unit related to the Concentration unit type of the evaluation. For example, if the Concentration unit type is set to Mass / volume, LOD/LOQ values must be expressed in mass unit.
It is important to recall that, while the concept of LOD/LOQ is widely used, its application is subject to interpretation. Depending on requirements, LOD/LOQ are sometimes deducted from the size of the noise on raw data (acting then more like a signal-to-noise ratio), or from the size of small peaks computed in some ways. Even visual determination can be considered valid. By the way, the USP defines a standardized way to determine LOD/LOQ values. Consequently, visionCATS includes 2 modes:
USP determination, which is the strict application of formulas provided by the USP. The determination is performed on reference calibration points, while sample calibration points are checked against the computed LOD / LOQ values.
Custom, where LOD and/or LOQ values are filled directly by the user after having been determined somehow, by any other method. In that case, the determination method should be documented in the Remarks.
Defining LOD/LOQ
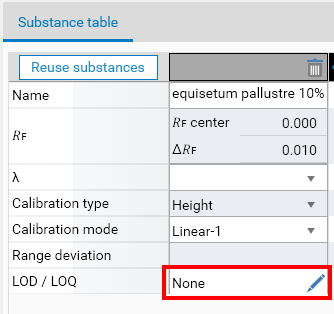
In the Definition tab, when the LOD / LOQ advanced option is activated, the substance table displays the mode for each substance, which is None by default:
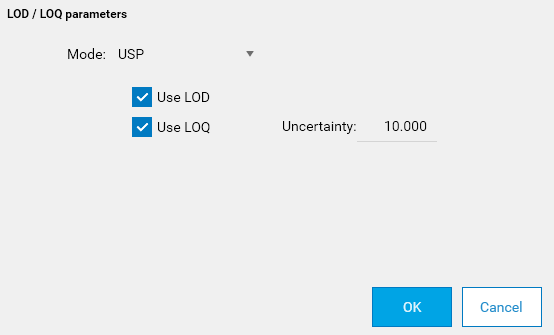
By clicking on the editing button, the LOD / LOQ parameters popup is displayed, where the mode can be changed. In Custom mode, configure whether the LOD and/or the LOQ checks must be performed and set the corresponding quantities:

In USP mode, the LOD / LOQ values are determined automatically. The Uncertainty parameter corresponds to the custom factor (usually 10) to apply during the computation of the LOQ :
Calibration and results
In the Calibration tab, LOD / LOQ values are shown respectively with Orange / Yellow vertical lines and Gray / Light gray areas:
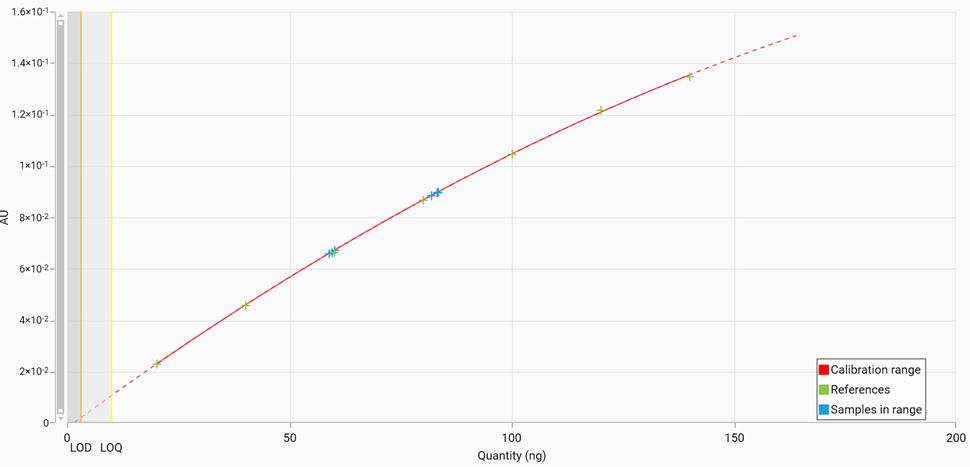
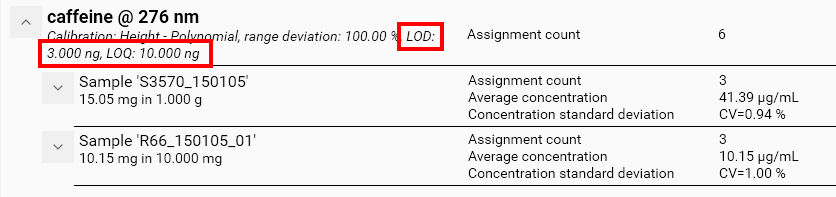
In the previous capture, all reference and sample points were located above LOD and LOQ. This is the nominal case which basically means that everything is in order. In the Results tab, the LOD / LOQ values are recalled in the description of the substance, while all results are computed as usual:
Specificities of the USP mode
Due to the way LOD / LOQ values are computed with the formula provided by the USP, Linear-2 calibration mode must be used with at least 3 reference points. The computation is performed automatically along with the calibration / results computation. The LOD / LOQ then appear exactly like in the Custom mode in the Calibration tab. Go to the Results tab to display the LOD / LOQ values computed by the formula:

LOD checks
In the following example, the LOD was set to 75 ng while reference points were located at 20/40/60 ng. The graph shows the reference points and the LOD but does not compute any calibration curve, consequently the sample points do not appear:
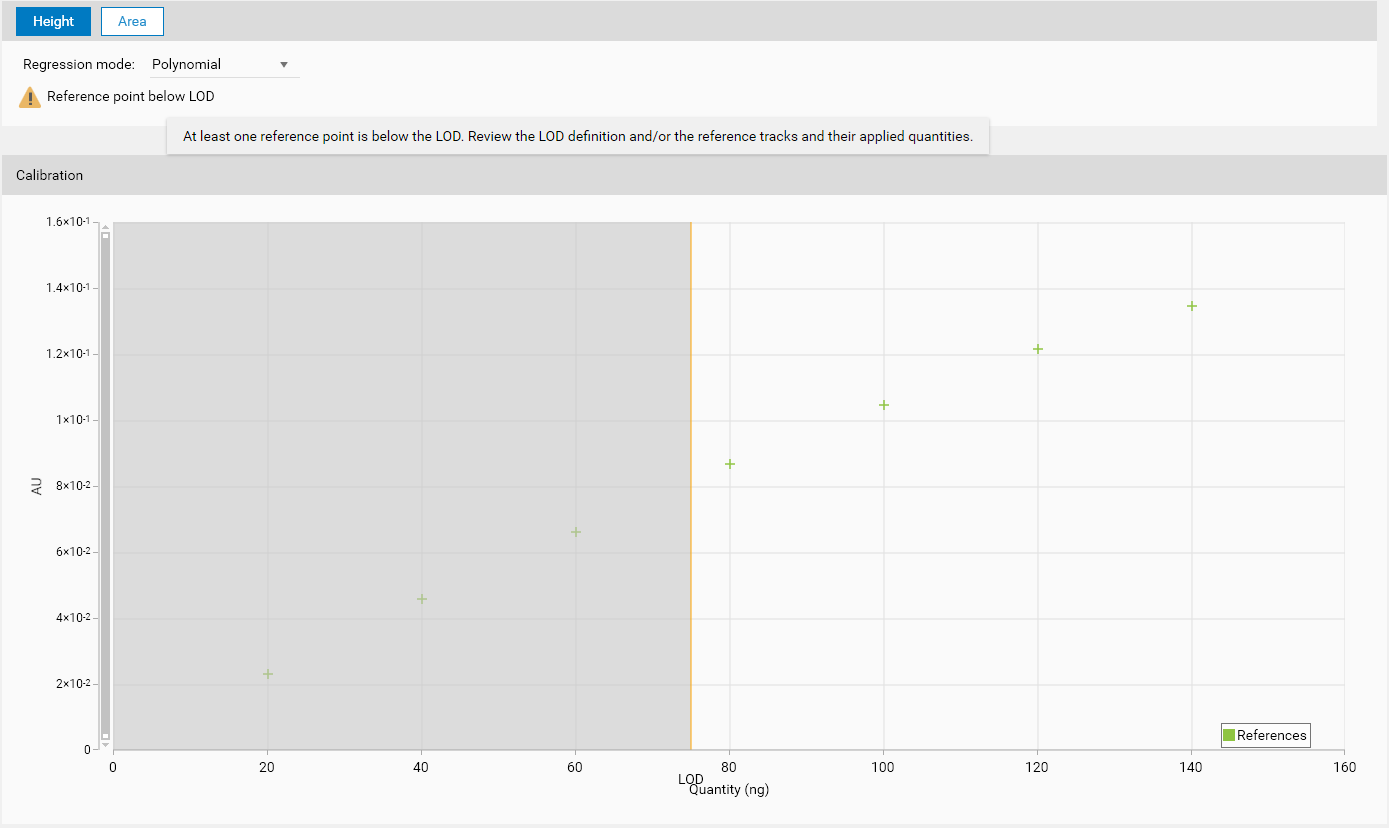
This case probably indicates a problem in the method/analysis definition, as the reference quantities and the LOD were both defined by the user.
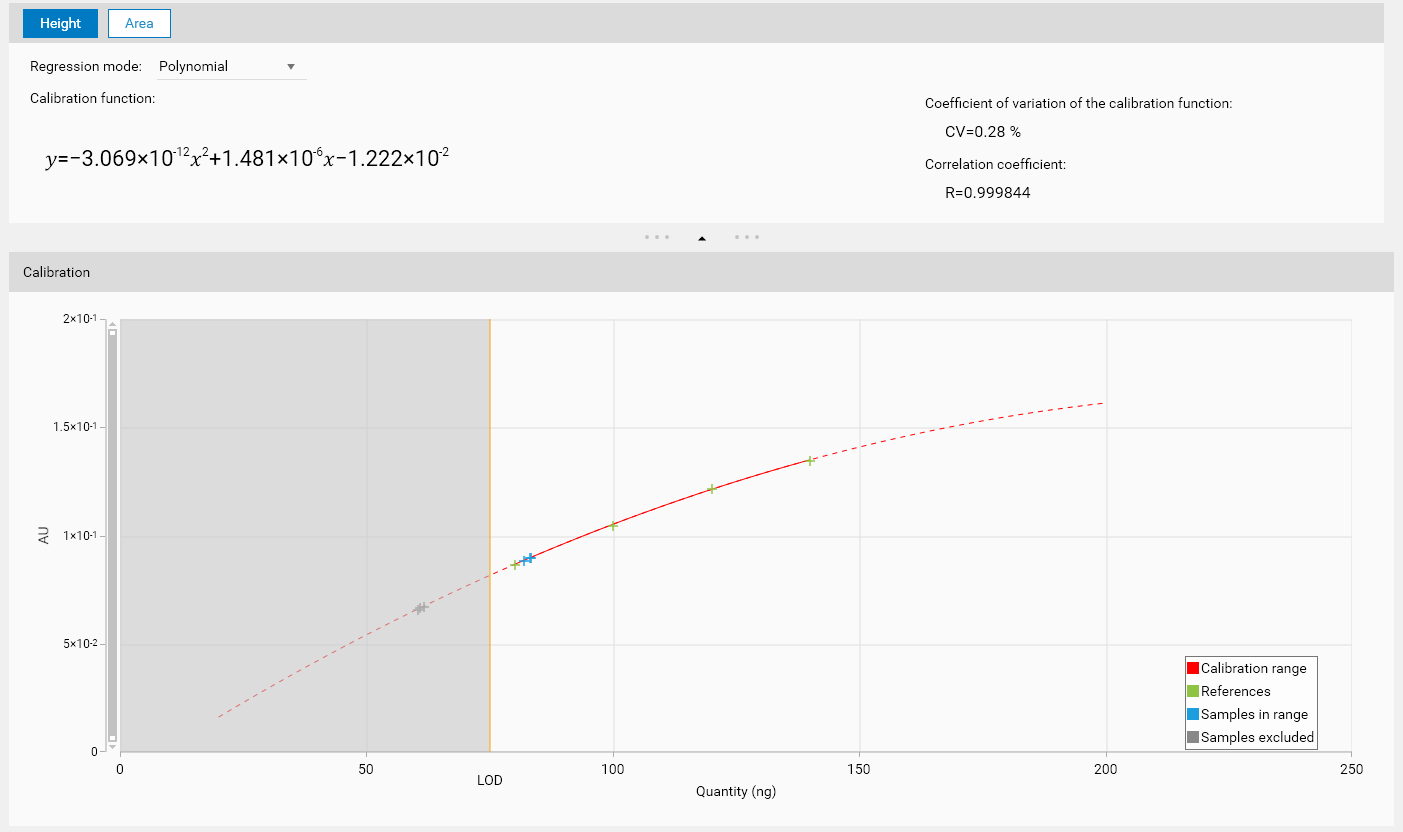
In the following example, the LOD of 75 ng was kept but the 20/40/60 ng reference points where manually unassigned, so that the calibration occurs. Some sample points at around 60 ng were excluded because they are below the LOD, though they were in the regression range:
For example, on sample track 9, the tooltip recalls that the value is below the LOD:
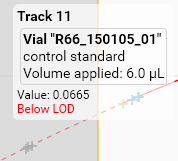
And in the Results tab, the track appears with a specific flag and the quantitative result is not computed:

LOQ checks
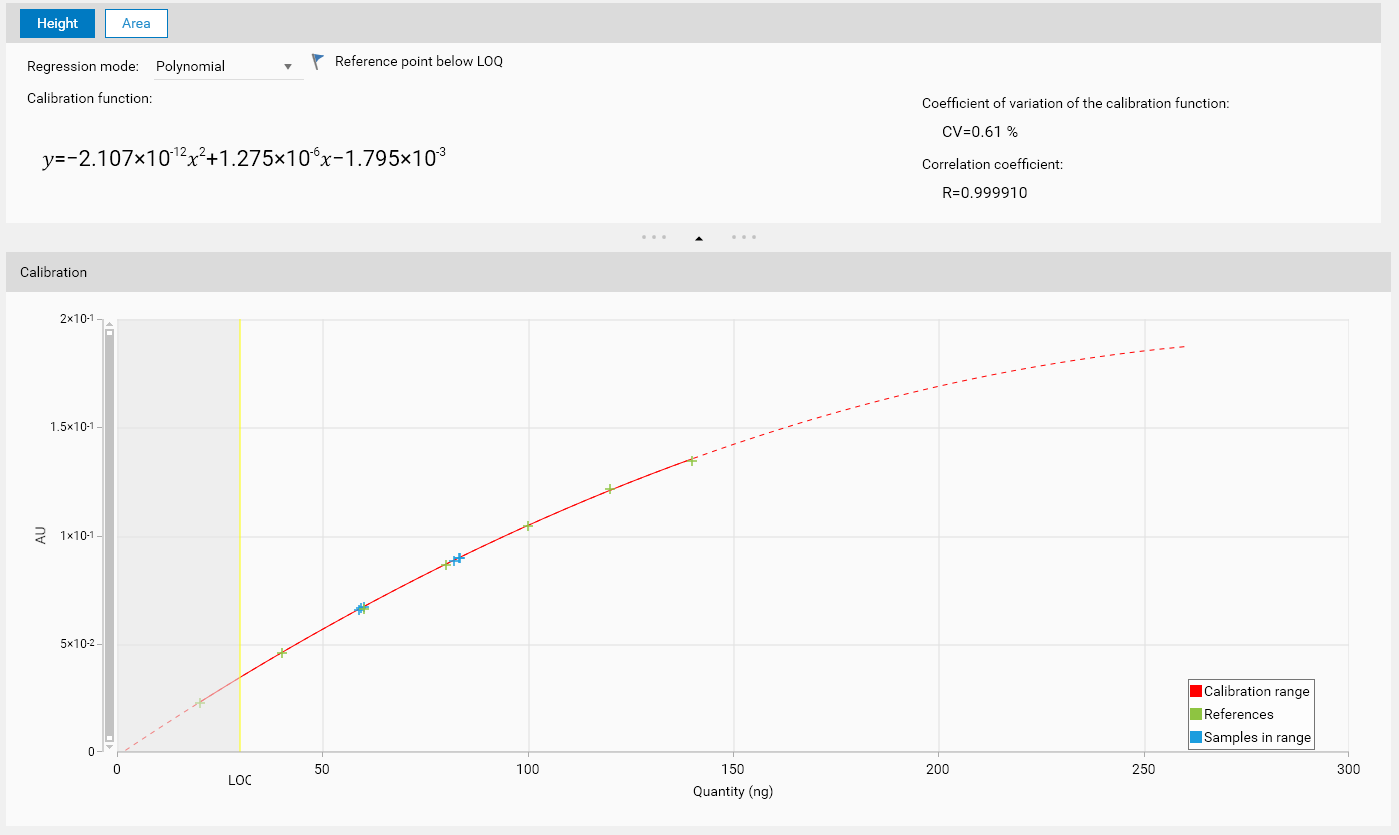
In the following example, a 20 ng reference point was below the LOQ defined at 30 ng:
In the Results tab, the same flag appears:

For Sample / Blank points below the LOQ, a specific legend item appears:
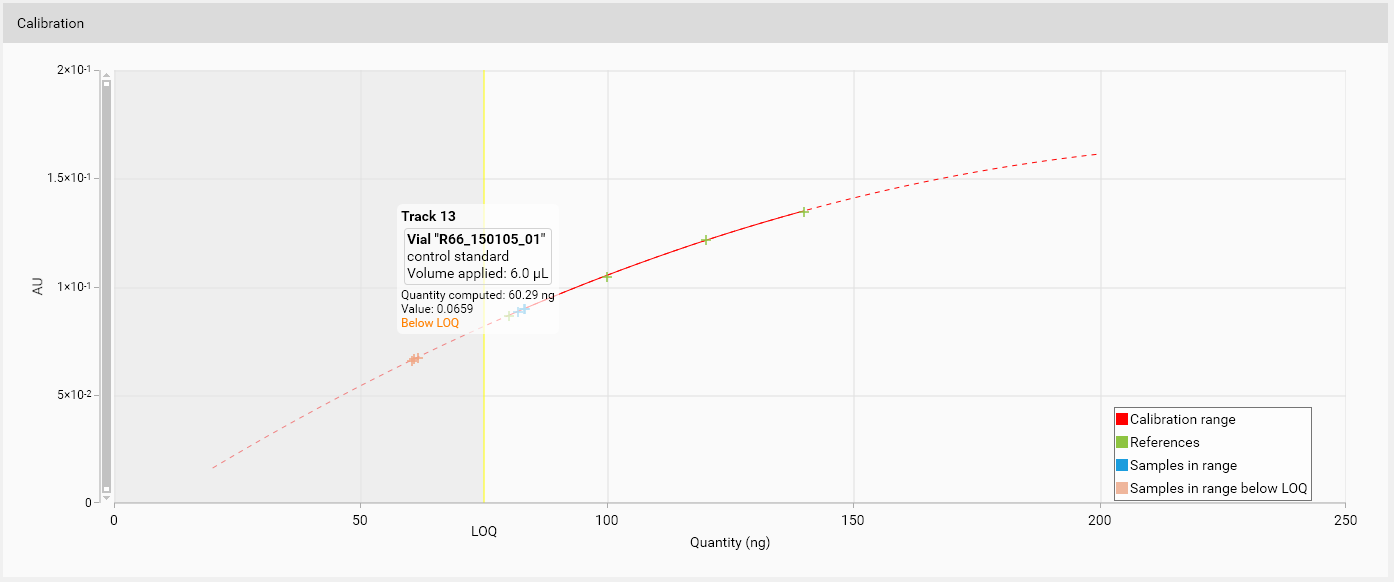
In the Results tab, the quantitative result is computed but a specific flag recalls that the quantity is below the LOQ:
