Correlation
The Correlation tab of the spectrum shows a tabular view of all the correlation values (purity correlation and correlation between tracks) computed for the current analysis.
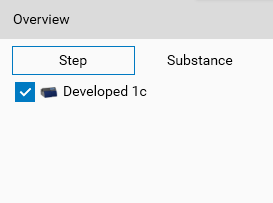
Overview
The Overview section allows you to filter the correlation data displayed, either by step or by substance. This is useful when having a lot of correlation data, or when having to compare the correlation obtained between several spectrum scan steps for a specific substance.
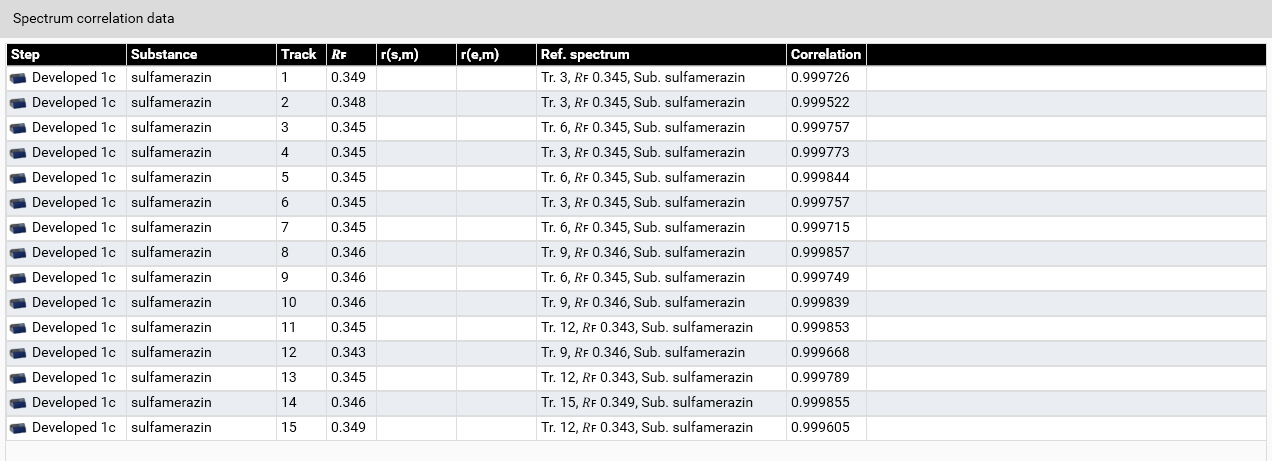
Spectrum Correlation Data
In this table, each row is a position of a spectrum scan step in the current analysis. Only positions having purity and/or correlation between track data are shown.