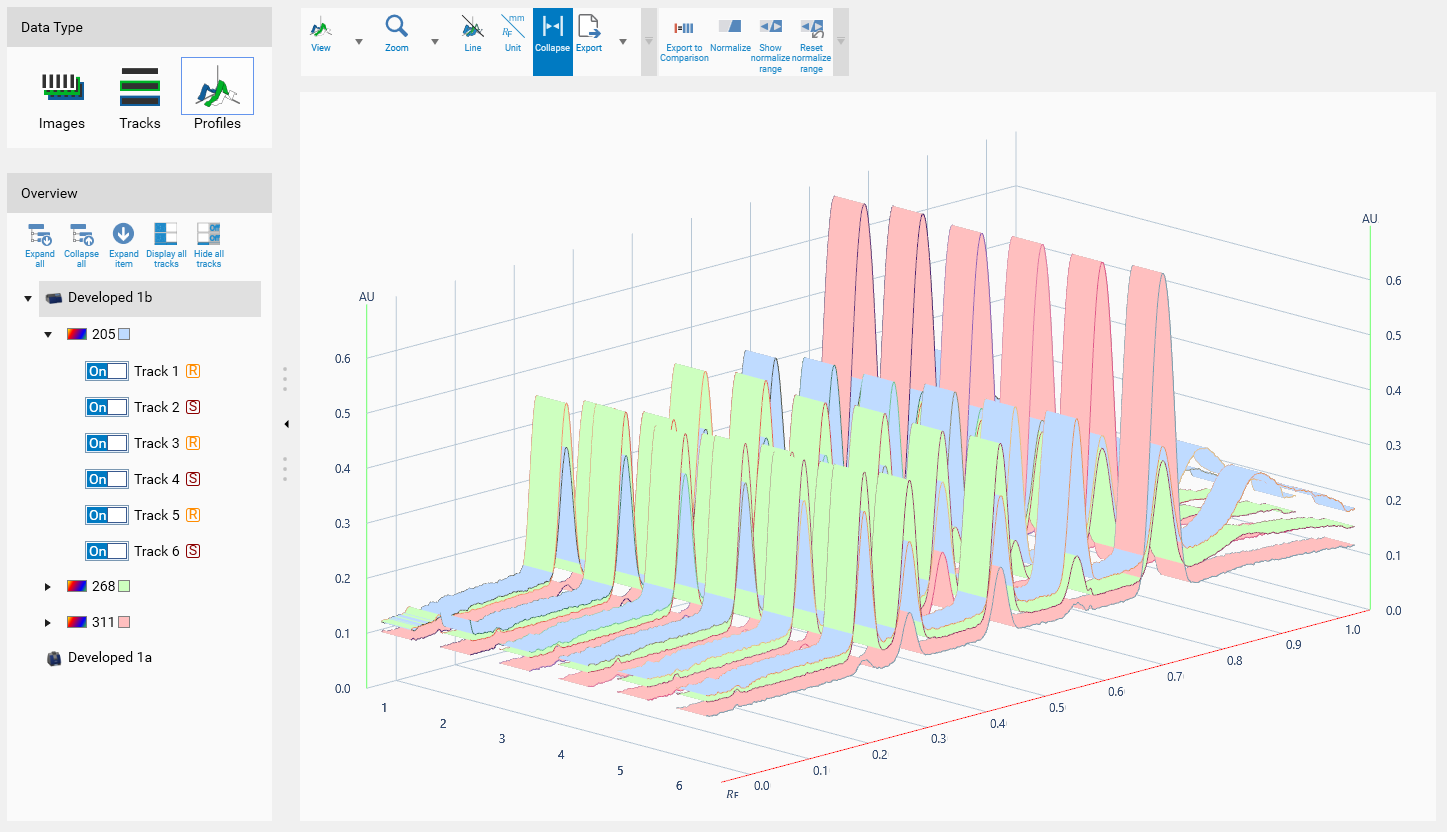
Profiles View
The profile view shows raw profile data taken during the execution of the scanner steps (Scanner 3 and Scanner 4) of the current analysis. When using the Generate Profiles function in DataView Toolbar, profiles generated from TLC Visualizer steps are displayed too.
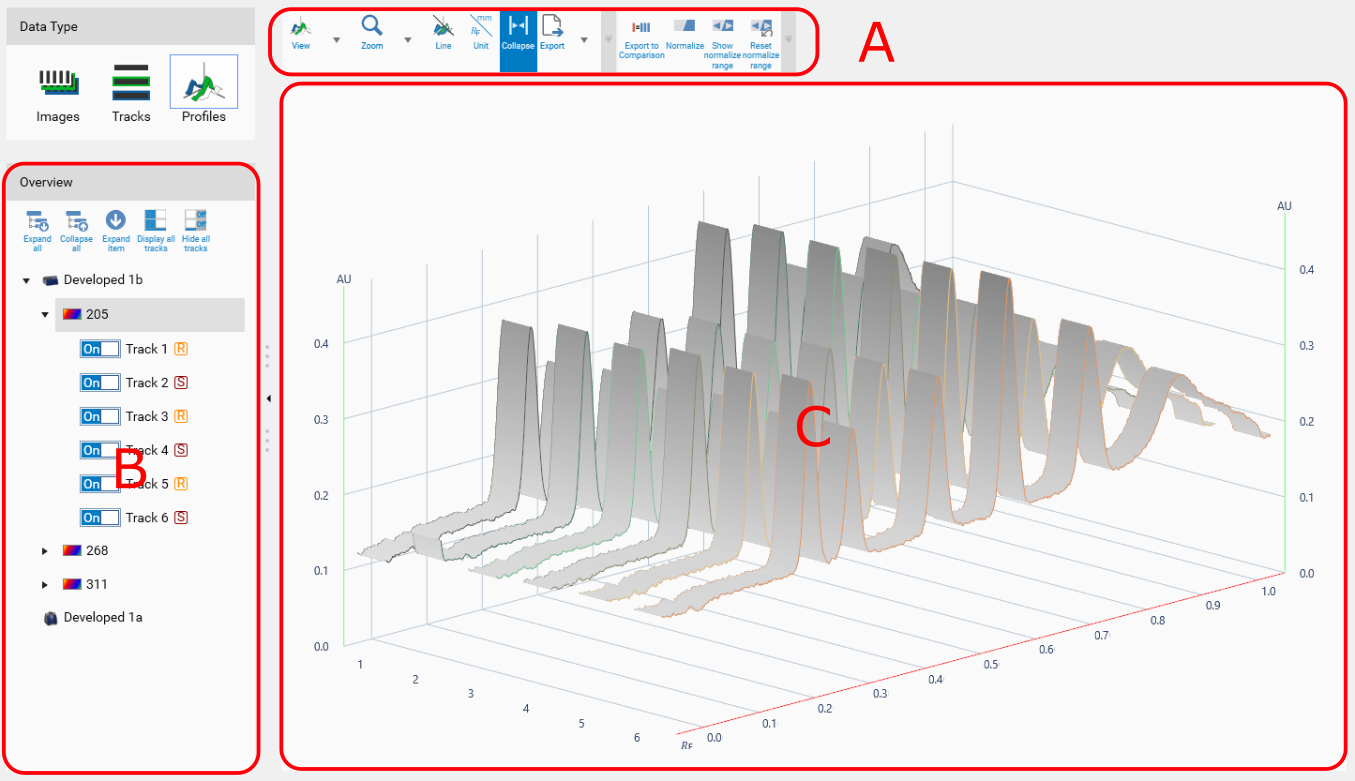
A Main toolbar, containing:
The view actions (see Profiles viewer and User Options to understand the different options).
The export functions (see Export of data for more details about the Export profiles (CSV) option).
The Export to comparison function, who will by default export the tracks and wavelengths/illuminations currently selected.
The profile normalization related actions
 Normalize
Activate/deactivate the profile normalization. When activated, visionCATS normalizes the profiles by considering that the maximum on the normalization range represents 0.9AU.
 Show normalize range
Display or hide the normalization range. The range is always a portion of a given track (by default, the first available track). When activated, the view automatically switches to the Top mode and the normalization range is displayed as a green overlay. By clicking on a track, you can change the track used for the normalization. By using drag/drop on the top/bottom segments of the exposure range segments, you can move the range.
 Reset normalize range
Reset the normalization range to the default value (first track available).
Important
The Normalize function of the profile is not equivalent to the Normalize exposure function of the DataView Toolbar.
B Overview
All concerned steps, the illuminations/wavelengths available and the tracks are shown here. Select one element in the tree view to see its profiles in the part (C). The Expand all, Collapse all and Expand item toolbar buttons can be use to facilitate the navigation in the tree, especially when using multi-wavelength scanning extensively. Each track can also be switched ‘On’ of ‘Off’ (individually or globally by using the Display all and Hide all buttons) when having to exclude some tracks or to focus on specific tracks. If a step is selected, the main part (C) will automatically affect a color for each wavelength/illumination.