Positioning
Use the Positioning tab to define the positions of the spectrum measurements to perform, by following these steps:
select, in the Overview section, the previously defined documentation step on which the spectrum scan step is based,
select the spectrum scan step to configure in the Spectrum Definition Table section and
add substances at the desired position(s) of the plate by using the Spectrum Definition Table and the Substance Positioning sections.
Overview
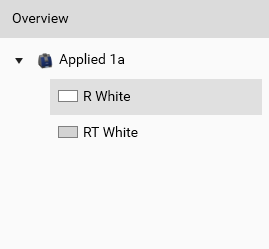
Select the illumination (for TLC Visualizer steps) or the wavelength (for Scanner steps) to display in the Substance Positioning section. Clean plate data acquisition steps are not shown. For TLC Visualizer steps, the profiles must be generated by using the Generate Profiles function in the Data tab of the analysis (see 𝑅ꜰ Tools and Tracks).
Spectrum Definition Table
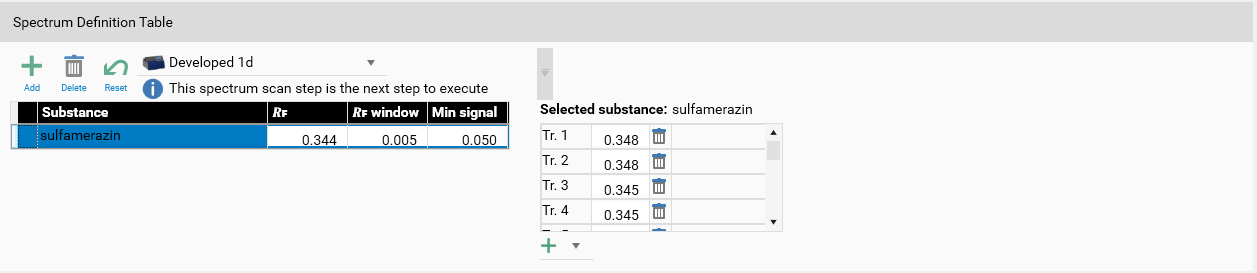
The Positioning view is primarily used to define the positions for the next step to execute. Therefore, this step (if any) is selected by default in the combo box, but other spectrum scan steps of the current analysis can be selected. Of course, it’s not possible to modify positions for an already executed spectrum scan step.
In visionCATS, each spectrum position is defined for a given substance which must be defined first, by clicking on the main Add button. Define or choose the name of the substance and edit the 𝑅ꜰ, 𝑅ꜰ window and Min signal fields. visionCATS searches, for each track, the local maximum in the range defined by the 𝑅ꜰ and 𝑅ꜰ window, and keeps the position found only if the luminance at this position is greater than the Min signal.
The right part can be use to manage individual positions of the currently selected substance:
Use the delete button to keep only the desired positions.
Manually edit the 𝑅ꜰ field to adjust the position if needed (possible only in the allowed range of the substance).
Use the Add button to add positions (available only on tracks where no spectrum position is defined for the substance)
If, for a given track, the local maximum does not exceed the Min signal, then N/A is displayed and the spectrum measurement will not be performed. The substance definition is considered invalid if no valid position is defined, i.e. at least one position must be defined with a 𝑅ꜰ value (not N/A).
Note
All positions for a substance are automatically recomputed when modifying the 𝑅ꜰ, 𝑅ꜰ window and Min signal fields. Therefore, any manual modification on positions within a substance has to be done after having defined the fields of the substance itself.
Substance Positioning

This section is similar to the one in the Substance assignment window. Instead of manually modifying 𝑅ꜰ and 𝑅ꜰ window in the Spectrum Definition Table, use the mouse to move the 𝑅ꜰ of each substance and its window. Furthermore, the substance selected in Spectrum Definition Table and its positions are highlighted, if any.
In the horizontal list on the right side, each track can be selected individually. Doing this allows to show only the corresponding profile in the left side. Use the Show profiles of all tracks to reset the track selection.
Note
When a single track is selected, hitting the main Add button in Spectrum Definition Table creates a substance with a single position on the selected track.
When the positions of the substances are correctly defined, the Continue button is activated and leads to the Execution tab.
Note
A warning will be displayed if the select instrument in Overview is a TLC Visualizer, as the plate positioning will be different from a TLC Scanner 3/4. The spectrum can then be measured slightly outside of the requested spot.