DataView Toolbar
The data Toolbar contains all tools you can use on the image data.

Note
Depending on the size of the window, some tools may not appear directly. When available, use the bottom arrows next to each toolbar to use the hidden tools.
General tools
 Select
The default tool used to select or edit added elements on the images.
 Grab
GrabGrab the image with this tool and move it in any direction to set a new view.
 Export image
Export image either to the file system or to the clipboard (to be pasted in another application (Word, Excel, etc…)). Export options allow to export the entire image or only the interesting area (tracks area), with or without annotations. In case of an export to the file system, the output DPI can be set. The exported image will also be cropped if Crop image is active.
𝑅ꜰ Tools and Tracks
Important
The 𝑅ꜰ tool/tracks positions should be correct by default, as defined in the Plate layout parameters. However, you may have to manually adjust it in some specific situations, for example when the plate wasn’t absolutely well positioned in the TLC Visualizer instrument.
Note
The color of the 𝑅ꜰ tool, tracks, annotations, tips and exposure normalization is set either to yellow, red or black, depending on the image illumination, in order appear clearly by default. You can change the color by right-clicking on the corresponding tool and select the appropriate contextual menu entry.
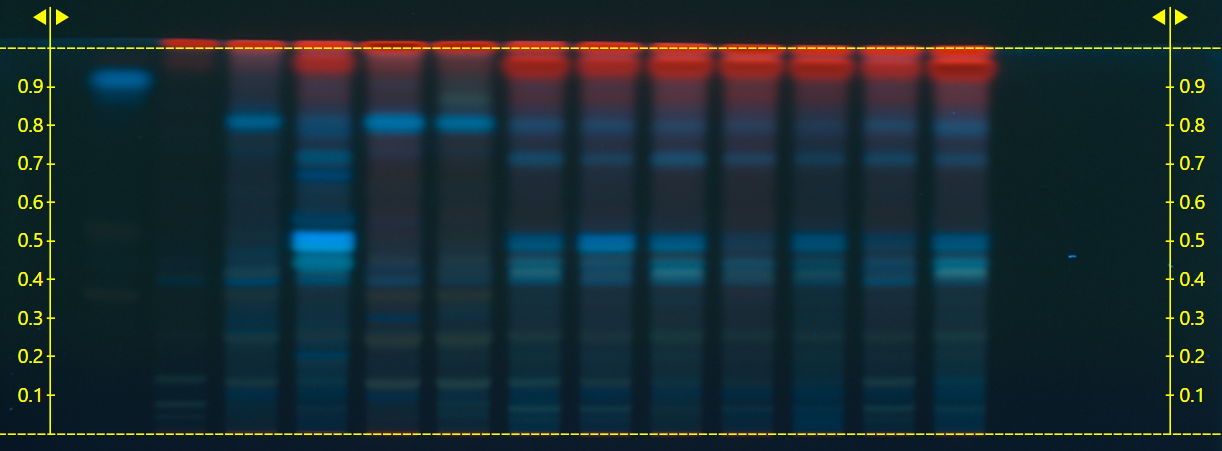
 𝑅ꜰ Tools
Toggle the visibility of the 𝑅ꜰ line and/or 𝑅ꜰ scale. Use the horizontal dotted lines to change the application and the front positions. Custom horizontal 𝑅ꜰ lines can be defined and saved to mark a specific position.
 Reset 𝑅ꜰ Tool positions
Reset the current 𝑅ꜰ Tool to its original position defined in the Plate layout parameters in Chromatography.
 𝑅ꜰ Tip
Mark a spot on the plate with the exact 𝑅ꜰ or metric value.
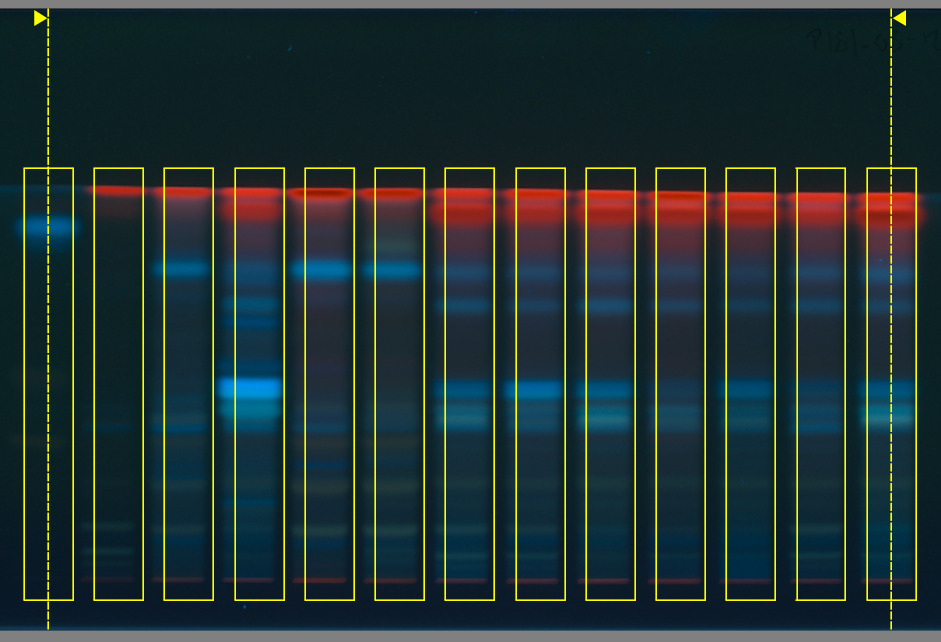
 Tracks
Toggle the visibility of the tracks to see where exactly does visionCATS “see” the tracks. Click on a track and move the vertical dotted lines in order to set the width of the tracks:
 Adjust Tracks Position
Use the vertical dotted line on the left to set the position of the first track, and the vertical dotted line on the right to set the distance between tracks.
 Reset position
Reset the tracks position to its original values.
 Export to comparison
Extract the selected track(s) and paste them into the comparison tool (see Export to comparison for more details)
 Generate Profiles
Generates the profiles of all the (non-clean) images of the current analysis based on the current position of the 𝑅ꜰ Tool.
Important
Deletes all output data (peaks, assignments, calibration functions and results) for evaluations based on a TLC Visualizer step. Only available if the current analysis does not contain any locked evaluation based on a TLC Visualizer step.
 Labels
Turn automatic labeling for the tracks on or off. Select a combination of Vial ID, description, application volume or track number (i.e. track number) to be displayed.
Vial ID
Description
Application Volume (not applicable for tracks with overspots)
Track Number
Always hidden in the toolbar overflow:
 𝑅ꜰ tool color
 Track color
 Labels text size
Image Settings
 Spot Amp
Amplify a region on the plate (increase contrast of an averaged small area on plate).
 White Balance
Select a small area on the image and adjust the color of the whole image to make this area exactly white.
 Reset changes
Reset the Image settings adjustments (Spot Amp, Parameters and White Balance).
 Crop image
Remove or show the 5mm background around each plate image.
 Clean Plate Correction
Clean plate correction lets you subtract an image of the clean plate from images after chromatography. There is already some structure on the plate before chromatography (like background noise in an audio recording). The subtraction will result in a cleaner, sharpened image of the plate.
Important
To do the subtraction, the plate should be on the same position on both images. visionCATS will try to detect any shift or rotation, but in some cases (especially for derivatized step) no matching is found. It is possible to still use the correction if wanted, but a visual check should be done to verify that no big shift or rotation exists (otherwise the correction would do more harm than good).
If already written on clean plate, the plate identifier notation makes a good indicator of the correction quality:
 A perfect clean plate notation will make the text practically invisible, without any shadow effect.
 A small shift will create some shadow on text, but the correction should still be beneficial.
 A big shift will be more like two layers of text, it is recommended to disable clean plate correction in this case.
HDRI Settings
The following tools are only available for HDRI images (which are only available for R366).
 Normalize exposure
The saturation of the defined zone (exposure range) is normalized to 85%. Only a standard-dynamic-range around the wanted exposure will be displayed, all the data outside the range will be overexposed (white) or underexposed (black). If the exposure range is placed on a representative track of the plate (normally a reference), the important information of the image will be correctly displayed.
Note
Enabling normalization will disable Clarify.
Note
By default, the normalization will be enabled, regardless of the saved state. To change this behavior, see Global Configuration.
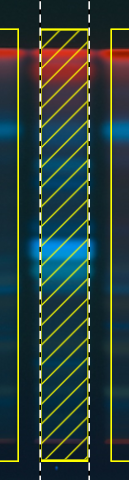
 Show exposure range
The current exposure range is displayed and can be modified graphically.
 Reset exposure range
The exposure range is reset to the original value, which is the first track of the plate.
 Clarify
Virtually change the illumination setting after capturing. Makes weak spots visible. It is a tone mapping technique which will compress the dynamic-range to makes most information visible on a limited dynamic-range monitor. The compression result in different color saturation and contrast than the reality, but more information is visible.
Enhancement slider: how much compression of dynamic-range will be done, making more or less information visible
Annotations
 Text
TextCreate a text box to put a comment on the plate image.
 Arrow
ArrowIndicate a specific area on the plate image with an arrow.
 Delete
Delete the selected Annotation items.
 Copy
CopyCopy the selected Annotation items.
 Paste
PastePaste the selected Annotation items.
Always hidden in the toolbar overflow:
 Color
ColorChange the color of selected Annotation items.
 Bold
BoldSet text weight of selected Annotation items to bold.
 Italic
Set text weight of selected Annotation items to italic.
 Underline
Set text weight of selected Annotation items to underline.
 Rotate Left
Rotate selected Annotation items counter clock-wise.
 Right Rotate
Rotate selected Annotation items clock-wise.
 Font
FontSet text font of selected Annotation items.
 Text size
Set text size of selected Annotation items.