Tracks View
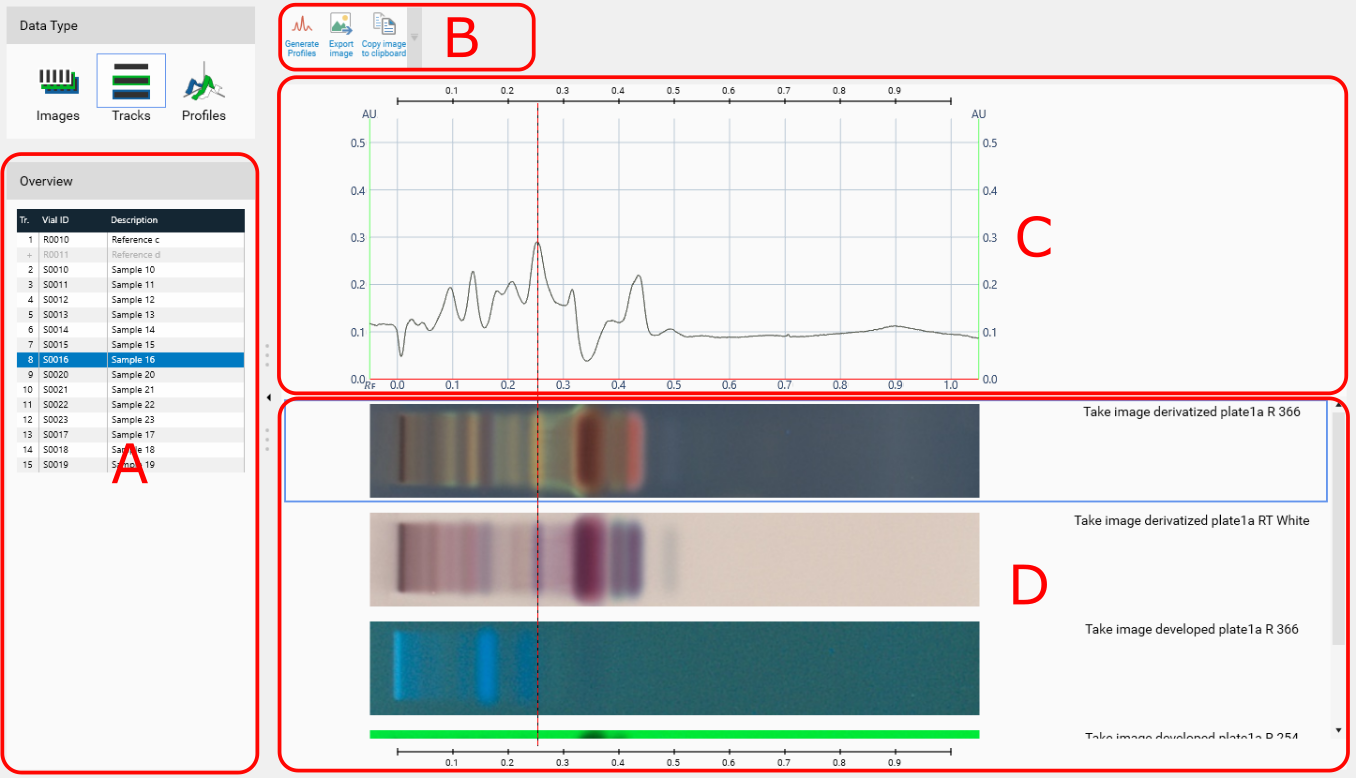
The track view shows all available data (image tracks, track scans), one track at a time across different wavelengths/illuminations.
Select the track to display in the grid. This will refresh the parts (C) and (D).
When Scanner Profiles is selected:
The (A) part displays a tree view where you can select a wavelength to display in (C) for the track selected. Use it to browse the track across the different plate states/wavelengths available. Get a multi-wavelength view for the selected track and for a single step by clicking directly on it (see following capture).
The (D) part is hidden.
Profiles generated from TLC Visualizer images are not displayed.
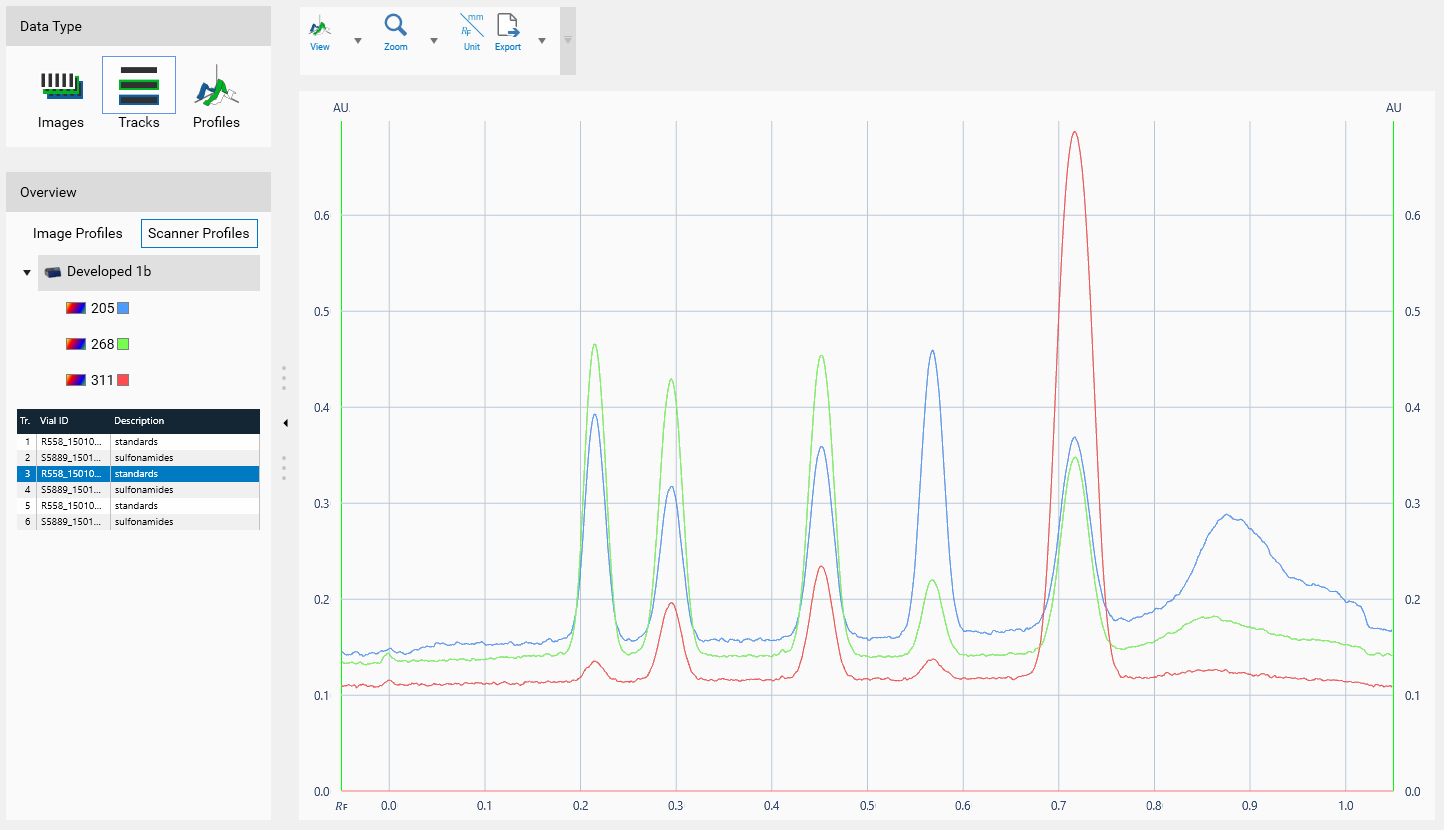
When Image Profiles is selected:
If the profiles has been generated from TLC Visualizer step images, then the (C) part is displayed.
The (D) part is displayed.
DataView Toolbar (limited)
Profile of selected track at selected illumination, see Profiles viewer
A click on an 𝑅ꜰ scale (top of (C) or bottom of (D)) creates an 𝑅ꜰ line which can be useful to compare 𝑅ꜰ positions and absorption/luminance across different wavelength, illuminations and plate states. 𝑅ꜰ Lines are saved in the analysis.
Track Image of selected track at all available illumination
The list of all track images, shown horizontally. A right click on an image allows you to export it to an image file.